
Figure 4.
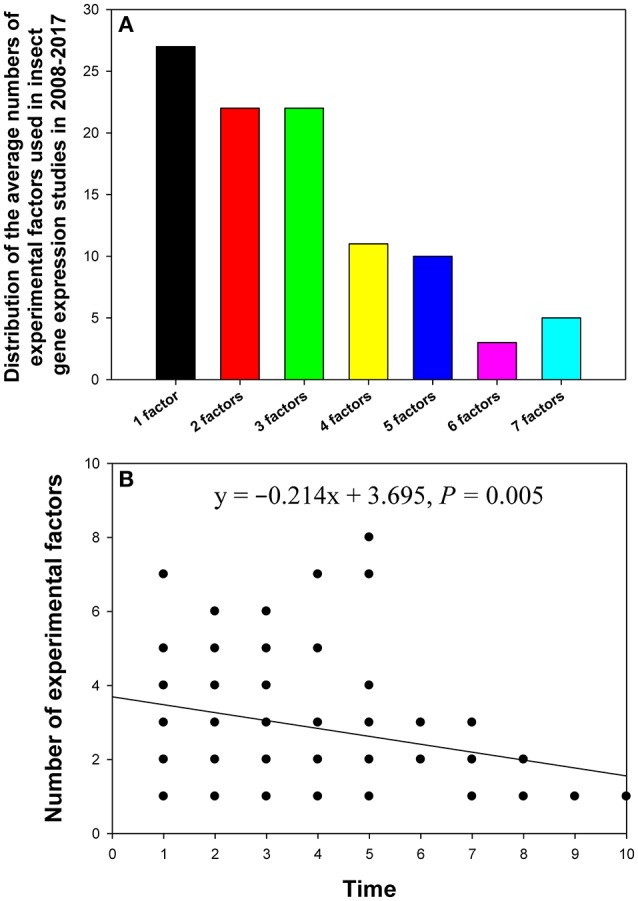
Distribution of the number of experimental factors in relevant insect gene expression studies performed during 2008–2017 (A), and the relationship between the number of experimental factors per study and study publication date (year) investigated by linear regression (B). The numbers 1–10 on the X-axis represent years from 2017 to 2008.