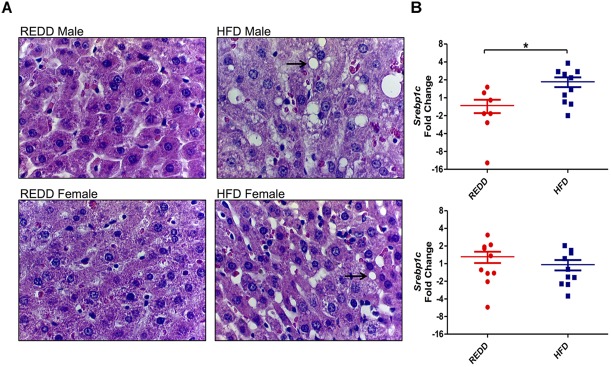
FIGURE 3.
HFD induces morphological changes in the liver. (A) Representative liver histology sections at 400× magnification of REDD-fed male (top left), HFD-fed male (top right), REDD-fed female (bottom left), and HFD-fed female (bottom right) rats. Arrows identify fat deposits. (B) Hepatic Srebp1c gene expression quantified by qRT-PCR between male (top) and female (bottom). Rplp0 expression was used as an internal standard. Results are expressed as Log2(Fold Induction) with repression values (i.e., <1) expressed as its negative reciprocal (i.e., 0.5 = -2). Numerical data are summarized as means ± SEM. ∗p < 0.05. REDD = reduced energy density diet; HFD = high fat diet.

