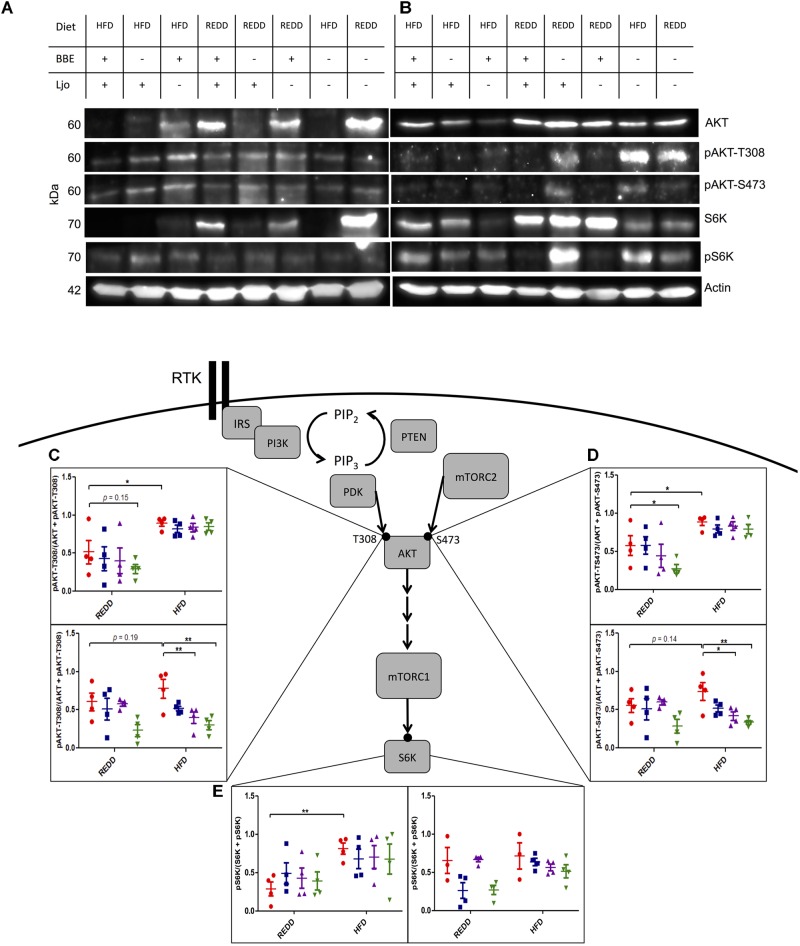
FIGURE 5.
Treatments effect mTORC1 activation in the stomach. Representative Western blot of the pattern observed in REDD and HFD treated (A) males and (B) females comparing the expression of the mTORC1 pathway in the stomach. Actin was used as an internal control. All samples were run in parallel. Images were minimally adjusted in contrast and brightness. Relative quantification of (C) pAKT-T308 for male (top) and female (bottom), (D) pAKT-S473 for male (top) and female (bottom), and (E) pS6K for male (left) and female (right) by densitometry analysis of Western blots. Proteins were extracted by homogenizing tissue in RIPA buffer. A Bradford curve using BSA as a standard was used for protein quantification and 30 μg of protein was separated on a 12.5% SDS-PAGE gel. Actin was used an as internal standard to ensure consistent loading and to normalize all samples. ImageJ was used to quantify intensity of bands. Phosphorylation levels were calculated by dividing the phosphorylation by the unphosphorylated and the phosphorylated form of the protein. Numerical data are summarized as means ± SEM. ∗p < 0.05, ∗∗p < 0.01. Red circle, control; blue square, blueberry extract; purple triangle, L. johnsonii; green triangle, blueberry extract + L. johnsonii. REDD, reduced energy density diet; HFD, high fat diet; BBE, blueberry extract; Ljo, L. johnsonii.

