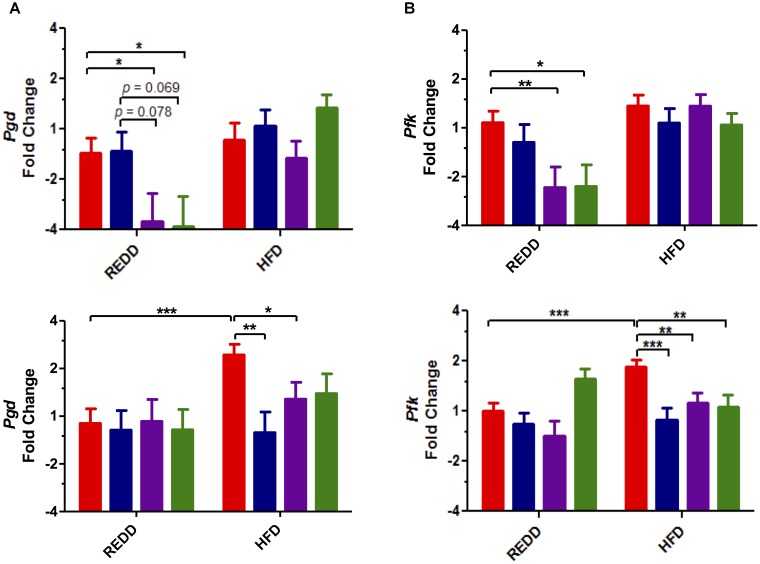
FIGURE 6.
Treatments affect the transcription of mTORC1-activated genes in the stomach. (A) Pgd gene (B) Pfk gene expression quantified by qRT-PCR in male (top) and female (bottom). Rplp0 was used as an internal standard. Results are expressed as Log2(Fold Induction) with repression values (i.e., <1) expressed as its negative reciprocal (i.e., 0.5 = -2). The number of animals analyzed for REDD Control, REDD + BBE, REDD + Ljo, REDD + BBE + Ljo, HFD Control, HFD + BB, HFD + Ljo, HFD + BBE + Ljo are as follows: Pgd Male, n = 9, 5, 8, 7, 5, 5, 7, 7, respectively, Pgd Female, n = 9, 6, 4, 5, 9, 5, 5, 3, respectively, Pfk Male, n = 10, 5, 8, 7, 9, 6, 8, 10, respectively, Pfk Female, n = 10, 6, 4, 4, 9, 5, 5, 4, respectively. Numerical data are summarized as means ± SEM. ∗p < 0.05, ∗∗p < 0.01, ∗∗∗p < 0.001. Red bar, control; blue bar, blueberry extract; purple bar, L. johnsonii; green bar, blueberry extract + L. johnsonii. REDD, reduced energy density diet; HFD, high fat diet.

