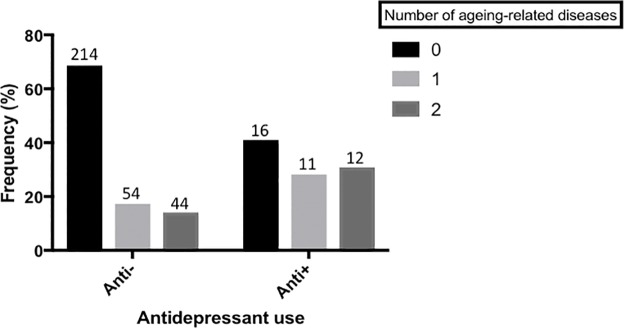
FIGURE 4.
Antidepressant use and aging-related disease. A bar chart showing the frequency of participants with 0, 1 or 2(+) aging-related diseases, split by those who are not currently taking antidepressants and those who are. Actual sample size within each group is shown on top of each bar. There is a significant difference in the frequency of aging-related disease between the two groups (p < 0.05). Aging-related diseases included: type-2 diabetes, arthritis, cardiovascular disease, stroke, high blood pressure, and cancer.

