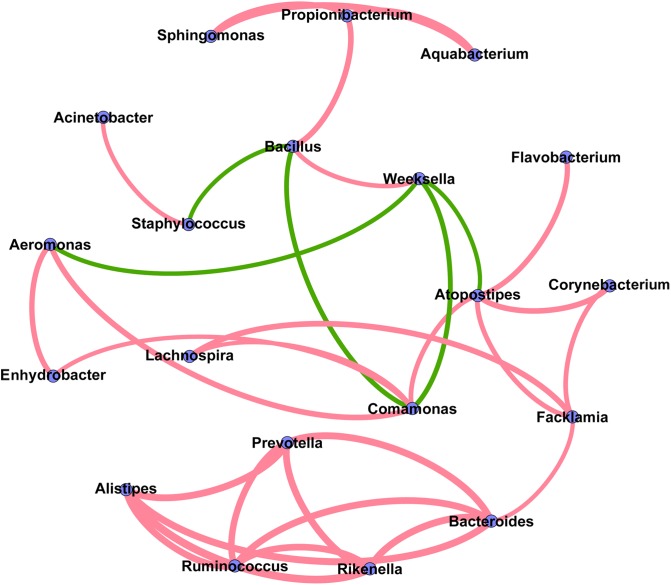
FIGURE 6.
Co-occurrence network of the predominant bacterial genera in the milk samples. Each node represents one genus, and each pair of genera connected by the line has a calculated Spearman’s correlation coefficient value > 0.5 or <–0.5 (P-value < 0.05). Red connecting lines represent the positive significant correlations and green lines represent the negative significant correlations. The thickness of each connecting line between two nodes (edge) is proportional to the absolute value of Spearman’s correlation coefficient.

