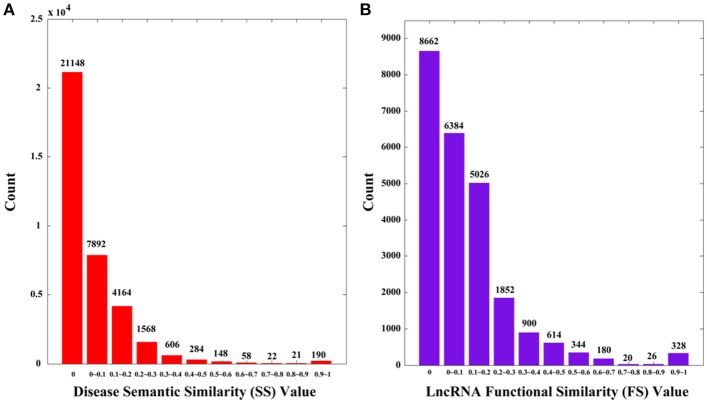
Figure 1.
The distributions of disease semantic and lncRNA functional similarity. (A) Disease semantic similarity (SS) distribution. (B) lncRNA functional similarity (FS) distribution. The x-axis indicates the intervals of similarity values and the y-axis indicates the numbers of values in the interval. The actual values are also marked above the histograms.

