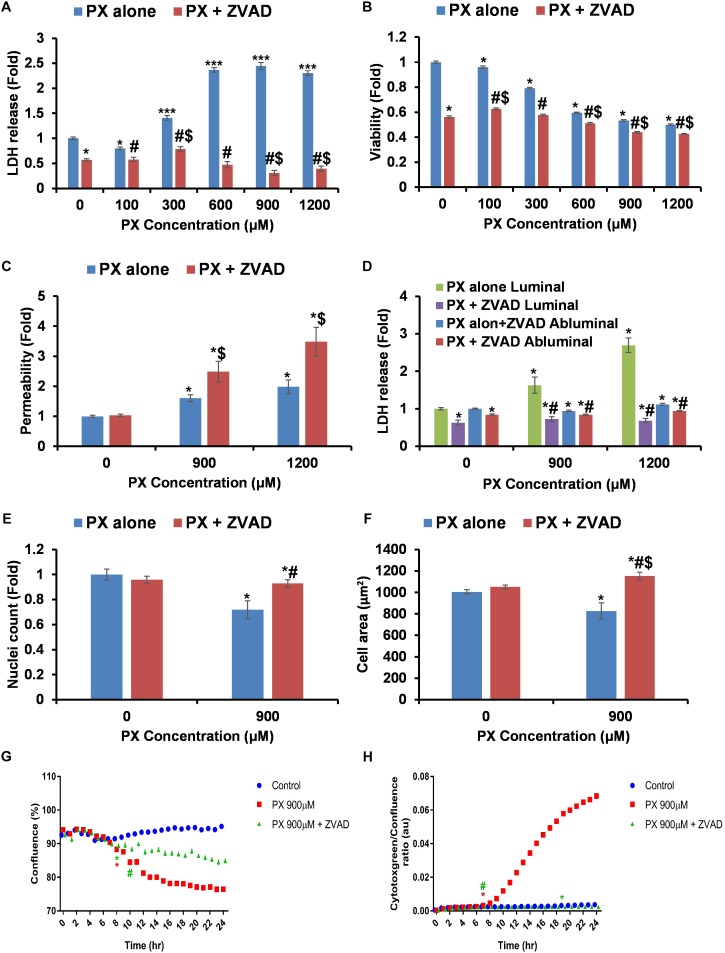
FIGURE 5.
Inhibition of caspases blocks cell death but does not restore the functionality of the barrier. (A,B) LDH release (n = 12–46 from four independent experiments) (A) and MTT assay (n = 11–20 from three independent experiments) (B) after 24 h PX treatment with ZVAD in a BLEC monolayer. (C) Co-cultures of BBB in vitro models were treated at the luminal side with PX + ZVAD for 24 h in a dose response experiment. Pe of NaF from luminal to abluminal side was measured (n = 12 Transwell inserts from three independent experiments). (D) LDH release at the luminal and abluminal sides of the co-culture BBB system was measured to assess cell death. (E) Nuclei number was counted with imageJ from at least six micrographs of BLEC monolayers treated with PX ± ZVAD for 24 h. (F) Cell area of BLEC monolayers treated for 24 h with PX ± ZVAD calculated with imageJ from AJ-immunostained BLECs micrographs (n = 117–190 cells per treatment from three independent experiments). (G,H) A representative time course experiment of BLEC monolayers treated for 24 h with PX ± ZVAD, phase contrast confluence is presented (%) (G) and cytotoxgreen staining is presented (H), the relative fraction of dead cells out of the whole population is presented as the ratio of green object confluence to phase confluence (a representative figure, out of three time course independent experiments is shown, n = 6 for each time point). ∗Marks the first time in which the PX treatment is significantly different from control according to plot color. Data presented as mean ± SEM. ∗p < 0.05 and ∗∗∗p < 0.05 vs. control, $p < 0.05 vs. control+ZVAD and #p < 0.05 vs. PX alone at the same concentration, respectively. All results without ZVAD in this figure were taken from the previous figures in this article.

