
Figure 2.
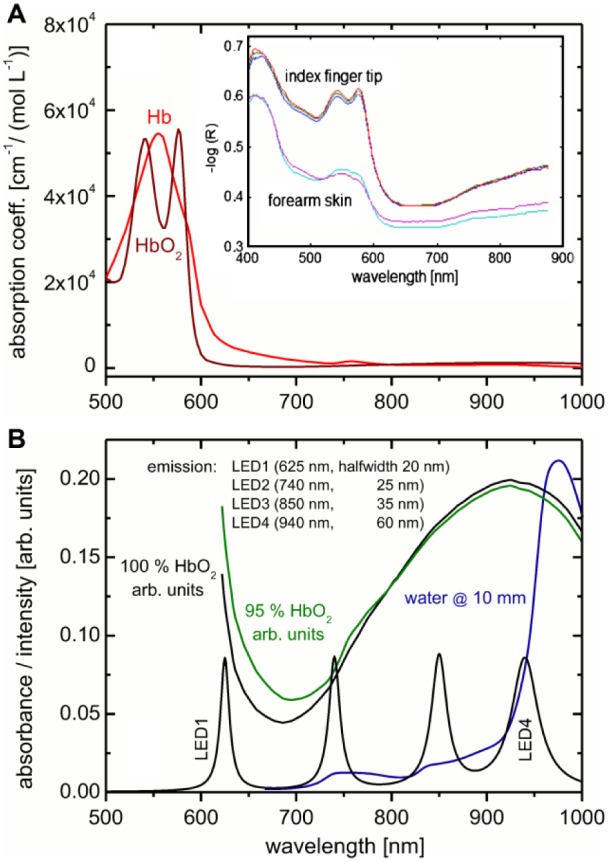
(A) Absorptivity data for oxy- and deoxy-hemoglobin (downloaded from https://omlc.org/spectra/hemoglobin/); the inset shows two diffuse reflection spectra of fingertip and forearm skin as measured with a fiber optic probe. (B) Spectra of hemoglobin at different oxygenation rates; included is the absorbance spectrum of water at 10 mm pathlength. Also shown is the illumination irradiance (intensity normalized) for four LEDs with indicated halfwidths from Hamamatsu Catalog18 at selected center wavelengths, as mentioned by Segman.10