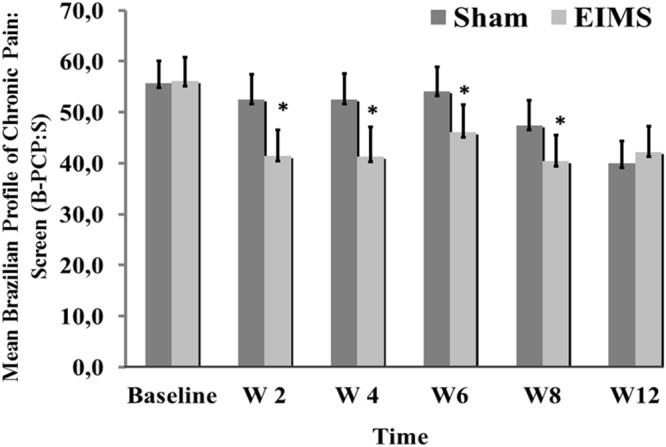
FIGURE 4.

Weekly mean pain and disability related to pain (as assessed by B-PCP:S) from baseline week (W2, W4, W6, W8, and W12) in the two experimental groups. The error bars indicate the standard error of the mean (SEM). Asterisks (∗) positioned above the bars indicate significant differences (P < 0.01) at those time points between the sham and the EIMS groups. All comparisons were performed by an analysis of Variance in the Mixed Model, followed by the Bonferroni correction for post hoc multiple comparisons.
