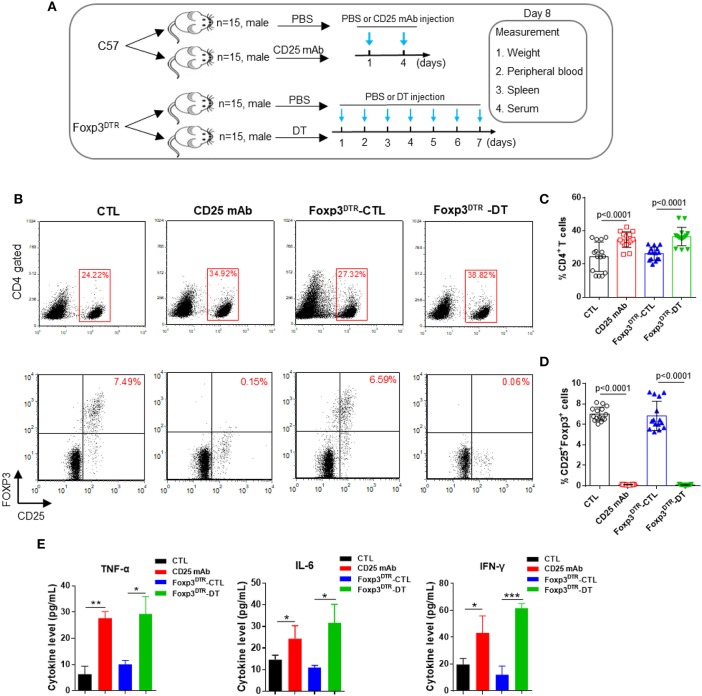
Figure 1.
Anti-CD25 mAb and diphtheria toxin (DT) depletes CD4+ CD25+ Foxp3+ Treg cells. (A) Schematic diagram illustrating the experimental design. The C57BL/6 and Foxp3DTR mice were divided into two groups (15 mice/group). Then, C57BL/6 mice were administered PBS or CD25 mAb every 3 days, while Foxp3DTR mice were continuously injected with DT for 7 days. On day 8, all mice were sacrificed, peripheral blood, spleen, and serum were collected. (B) Analysis of CD4+ T cells and CD4+ CD25+ Foxp3+ Tregs in peripheral blood. (C,D) Statistical analysis of the percentages of CD4+ T cells and CD4+ CD25+ Foxp3+ Tregs in the mice of four groups. (E) Circulating TNF-α, IL-6, and IFN-γ levels in four groups of mice (n = 15). All the values are shown as the mean ± SEM. *P < 0.05, **P < 0.01, and ***P < 0.005.

