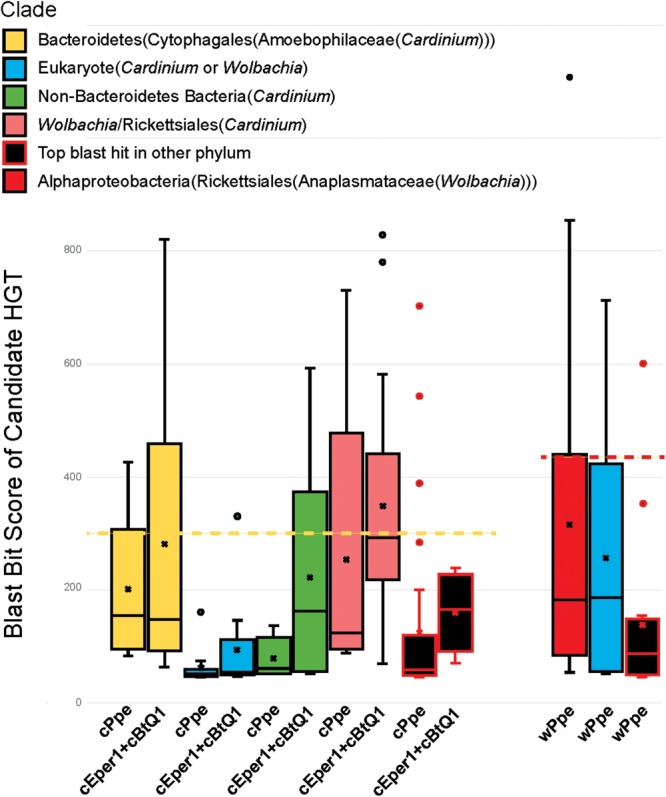
FIGURE 9.

Relative ranges of blast bit score for candidate HGT genes, by phylogenetic clade of blast hits. Relative divergence (in blast bit score) of candidate HGTs compared with ordinary flanking genes in Cardinium cPpe from P. penetrans, Cardinium cBtQ1/cEper1 from insects (yellow boxes), and Wolbachia wPpe from P. penetrans (red boxes). Black boxes indicate top blast hits outside the clades Cardinium or Wolbachia, while other colors indicate the top hit matches Cardinium or Wolbachia, but all remaining hits match distant taxa (blue = eukaryotes, green = other bacterial phyla, pink = Wolbachia/Rickettsiales). Dotted lines serve as a visual guide to indicate the range in blast bit scores relative to the upper quartile of cPpe and wPpe genes for which the gene tree matches the species tree. (Box and whisker plot: box represents interquartile range, whisker represents remaining quartiles, with midline and ‘x’ denoting the median and mean, respectively, and outliers as dots beyond 1.5 times the interquartile range.)
