FIGURE 5.

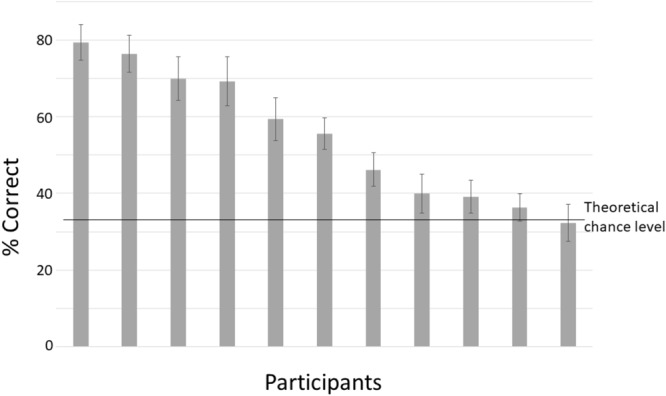
Mean classification accuracy for the testing set, separately for each participant. Chance level is 33%. Error bars denote standard deviations.

Mean classification accuracy for the testing set, separately for each participant. Chance level is 33%. Error bars denote standard deviations.