FIGURE 8.

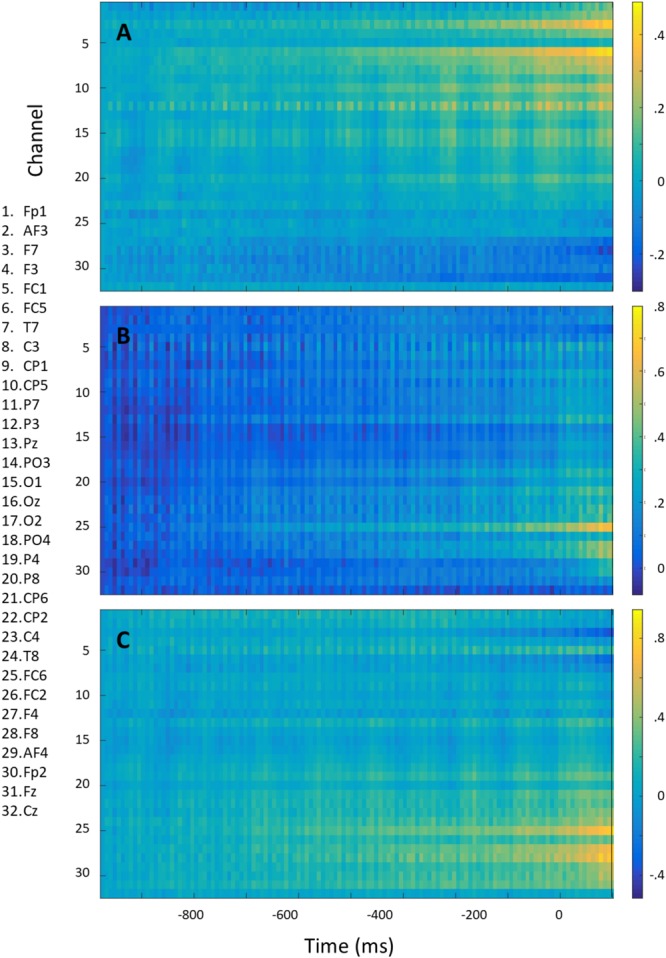
Mean voltage over the 1000 ms preceding right (A) and left (B) rotation onset and their difference (left minus right) (C) for each electrode. Epochs were baselined on –1000 ms.

Mean voltage over the 1000 ms preceding right (A) and left (B) rotation onset and their difference (left minus right) (C) for each electrode. Epochs were baselined on –1000 ms.