Figure 5.
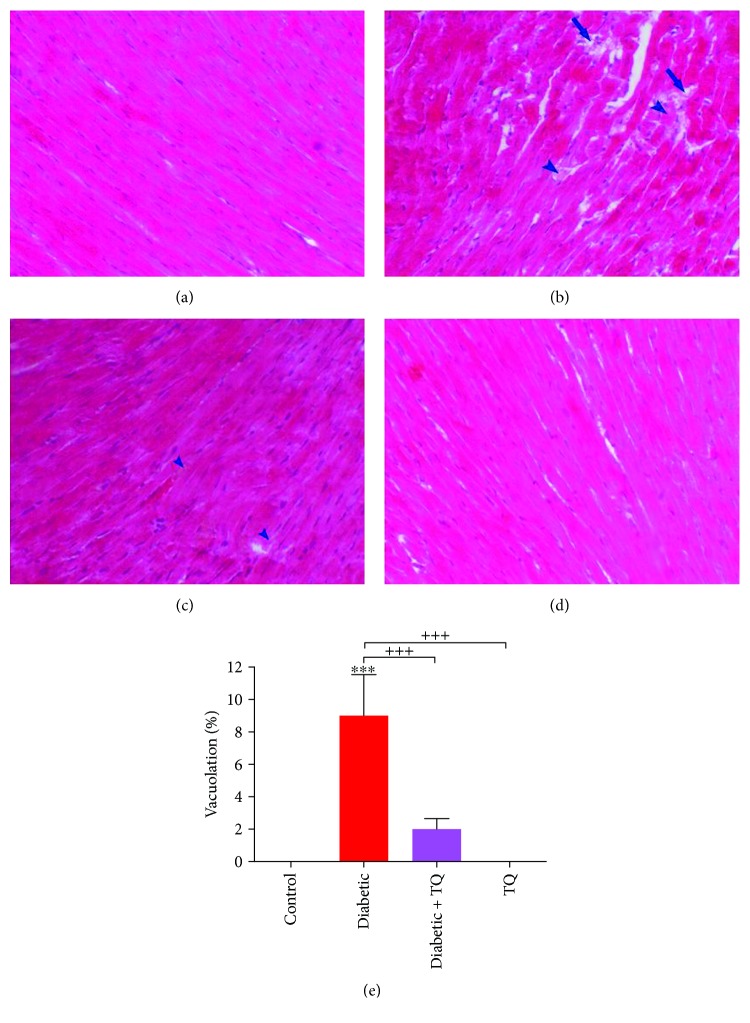
Photomicrograph of the rat myocardium showed normal myocardial fiber architecture in the negative control group (a) and TQ group (d). Photomicrograph of diabetic (b) and diabetic + TQ groups (c) showed myocardial degeneration (arrowhead) and vacuolation (arrow). H&E, ×200. (e) Vacuolation percentages. ∗∗∗p < 0.001 vs. control. +++p < 0.001 vs. diabetic.

