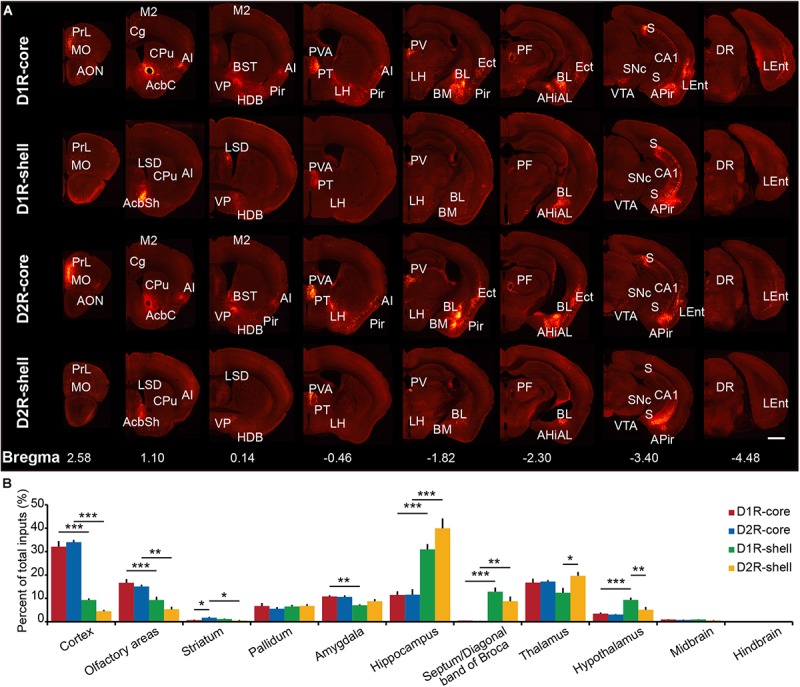
FIGURE 3.

Overview of whole brain input to D1R-MSNs and D2R-MSNs in different NAc subregions. (A) Representative coronal sections showing labeling of monosynaptic inputs to D1R-core, D1R-shell, D2R-core, and D2R-shell neurons. Only the side ipsilateral to the injection site is shown. Scale bar, 1 mm. (B) Proportions of total inputs from 11 brain areas. Mean ± SEM (n = 6 mice each for the D1R-core, D1R-shell, D2R-core, and D2R- shell groups). ∗∗∗p < 0.001, ∗∗p < 0.01, and ∗p < 0.05. Only significant differences between the same cell type in different subregions or between different cell types in the same subregions are marked; one-way ANOVA with Bonferroni correction.
