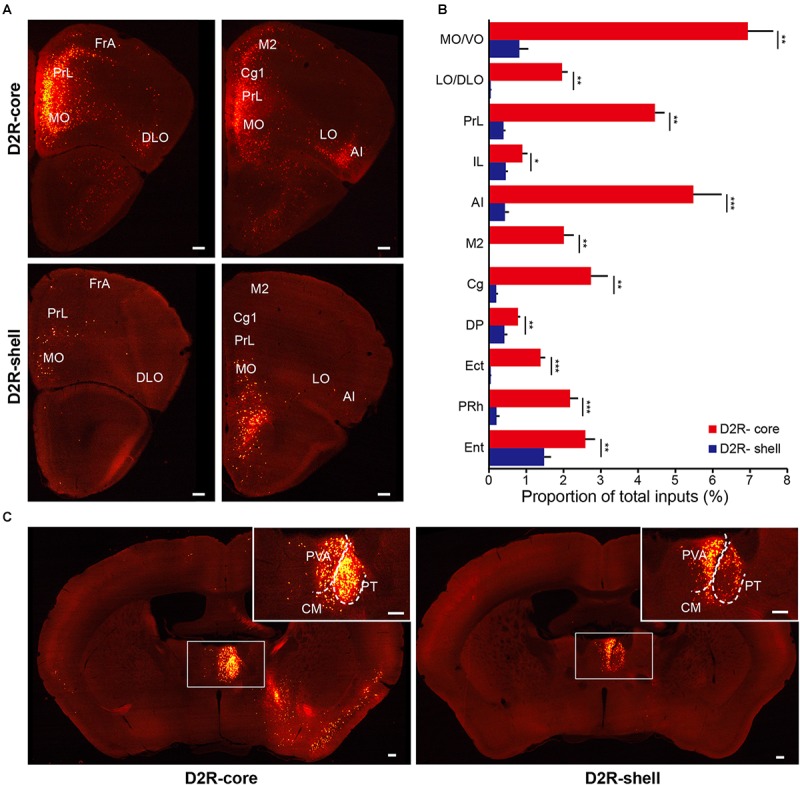
FIGURE 6.

Monosynaptic inputs to D2R-MSNs from the cortex and thalamus. (A) Distributions of anterior cortex inputs to D2R-MSNs in the NAc core (upper panels) and shell (lower panels). Scale bar, 200 μm. (B) Proportion of total inputs to D2R-MSNs in the NAc core (red) and shell (blue) from 11 cortical areas that contained relatively large numbers of input neurons (>1% in at least one experimental group). Mean ± SEM (n = 6 mice for each group). ∗∗∗p < 0.001, ∗∗p < 0.01, and ∗p < 0.05, two-tailed unpaired t-test or Mann–Whitney U test. (C) Distributions of thalamic inputs to D2R-MSNs in the NAc core (right) and shell (left). Inset, enlarged view of the area in the white box showing spatially separated labeling. Scale bar, 200 μm.
