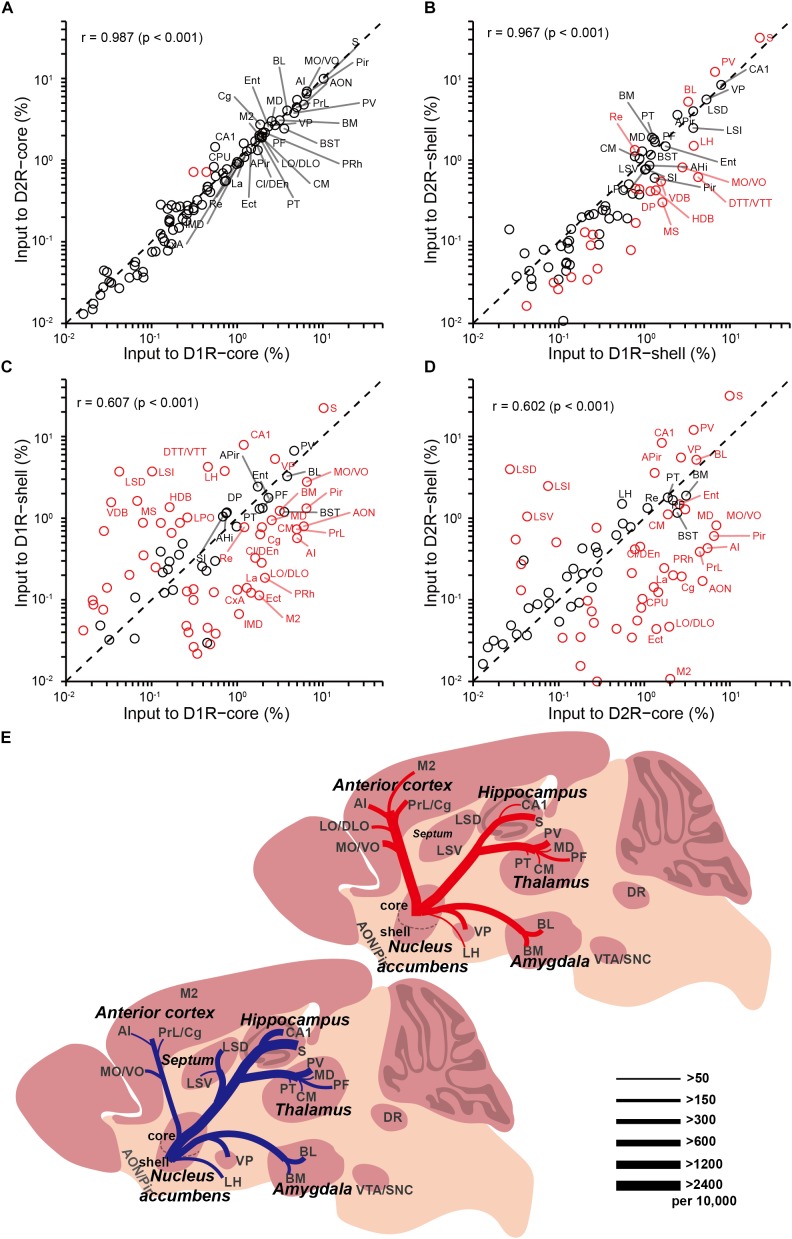
FIGURE 7.
Comparisons of input distributions across the four groups. (A) Comparison between inputs to D1R-core and D2R-core neurons. (B) Comparison between inputs to D1R-shell and D2R-shell neurons. (C) Comparison between inputs to D1R-core and D1R-shell neurons. (D) Comparison between inputs to D2R-core and D2R-shell neurons. Values are the means of the percent of total inputs from each region. Red circles indicate significant differences (p < 0.05, two-tailed unpaired t-test or Mann–Whitney U test). r, Pearson’s correlation coefficient. (E) Summary of selected prominent monosynaptic inputs to the NAc core (top, red) and shell (bottom, blue), considering D1R-MSNs and D2R-MSNs together. Line thickness represents the number of inputs.

