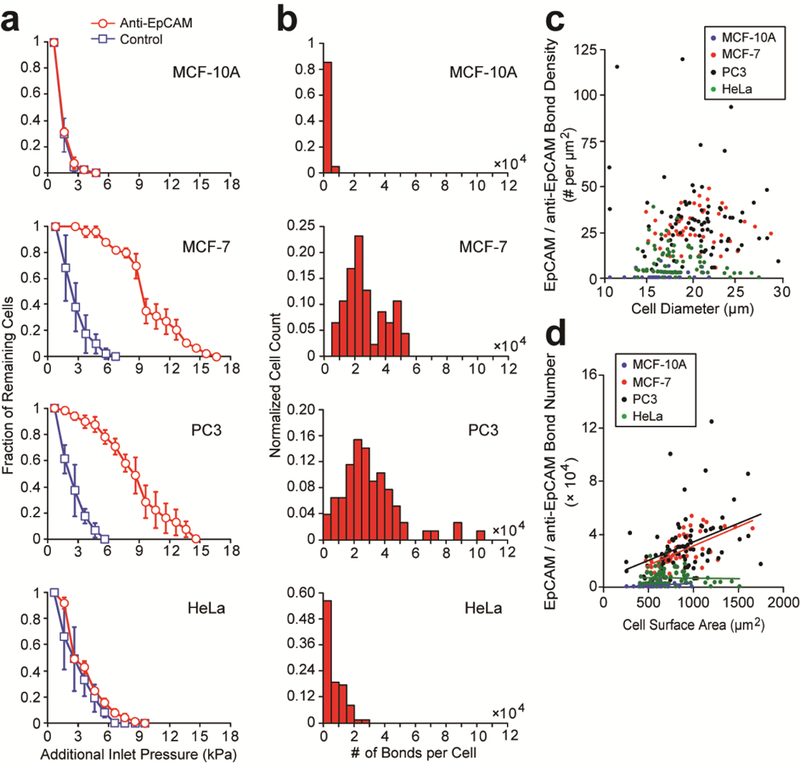
Figure 6.

Quantification of EpCAM expression of cancer cells using the elasticity microcytometer. (a) Fraction of live single cancer cells remaining trapped in confining channels of the elasticity microcytometer as a function of additional hydraulic pressure applied to flush out cancer cells from confining channels. Confining channels were either coated with pluronics F-127 (control) or antibodies against EpCAM as indicated. Errors bars, s.e.m. (b) Histogram of the number of EpCAM/anti-EpCAM bonds for different cancer cell types as indicated. n > 50, with two separate experiments for each cell type. (c) Scatter plot of EpCAM/anti-EpCAM bond density vs. cell diameter. Each data point represents an individual cell. Data was pooled from the four cancer cell types as indicated. (d) Scatter plot of total EpCAM number vs. cell surface area. Each data point represents an individual cell. Data was pooled from the four cancer cell types as indicated.
