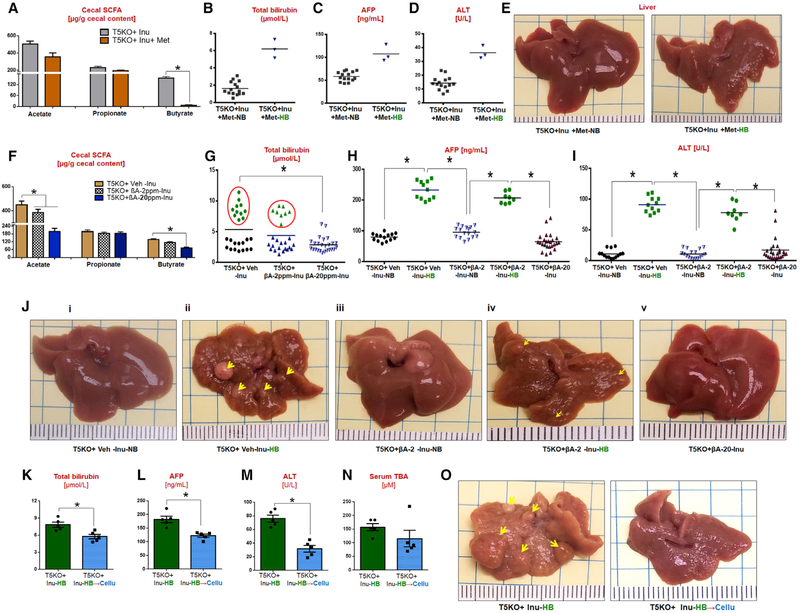
Figure 5. Targeting Butyrate Producers, Bacterial Fermentation, and Dietary Interventions Prevent HCC in ICD-Fed T5KO Mice.
(A-E) Metronidazole treatment group: (A) cecal SCFA, (B) total bilirubin, (C) AFP, (D) ALT, and (E) gross liver.
(F-J) β-acid treatment group: (F) cecal SCFA, (G) total bilirubin, (H) AFP, (I) ALT, and (J) gross liver (arrows indicate tumor nodules). HCC incidence: vehicle, ~39%; 2 ppm β-acid, ~10%; 20 ppm β-acid, 0%.
(K-O) ICD → CCD switch group: (K) total bilirubin, (L) AFP, (M) ALT, (N) TBA, and (O) gross liver (arrows indicate tumor nodules).

