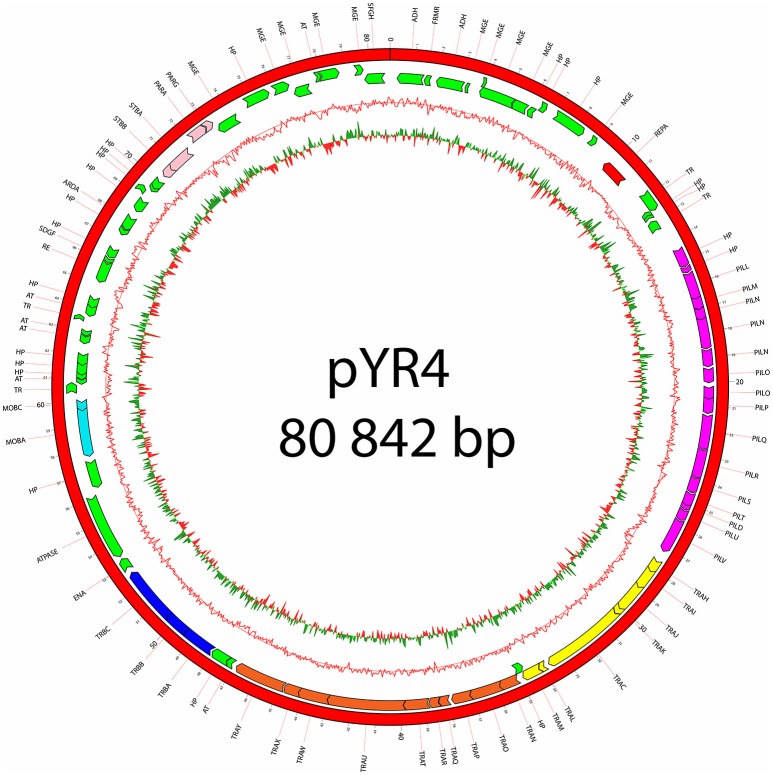
Figure 2.
Plasmid map of pYR4 isolated from Y. ruckeri NVH_3758. The sequence annotations were generated with RAST (Rapid Annotation using Subsystem Technology) and further analyzed with HHpred. The rings show from inside to outside (1) the GC skew, (2) the G+C content, (3) the position of predicted ORFs in the reverse strand, and (4) the position of ORFs in the forward strand. The gene annotations are positioned in the middle of each gene on the plasmid map. Gene clusters are indicated in different colors: light blue (mobilization gene cluster), yellow (tra1 gene cluster), orange (tra2 gene cluster), dark blue (tra3 gene cluster), magenta (pil gene cluster), pink (partitioning gene cluster). Replication initiation protein is indicated in red. Hypothetical proteins (HP) and mobile genetic elements are indicated in green.

