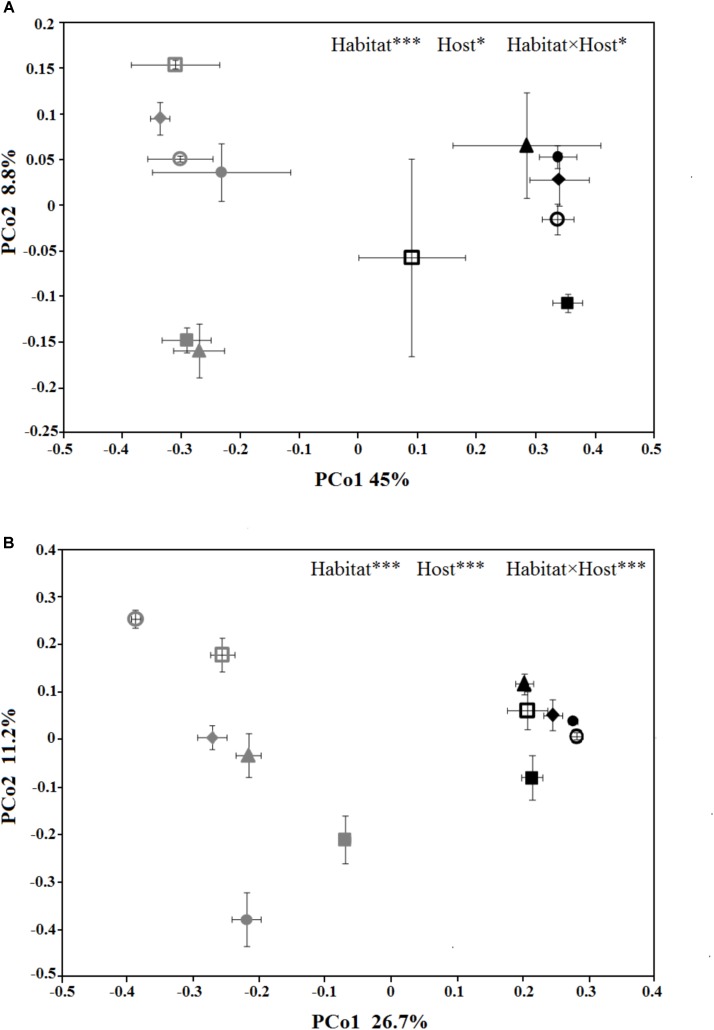
FIGURE 3.
Principal coordinates analysis (PCoA) ordination of the bacterial/archaeal (A) and the fungal (B) communities, associated to the six spruce species phyllosphere and near-root soil. The values are means of three replicate samples plus SE for each host type. The symbols are as follows: triangles = PL; solid squares = PS; solid circles = PA; empty circles = PC; empty squares = PK; and diamonds = PW. The full name of each plant species is reported into the text. The symbols color-gray and black, indicate microbial communities in phyllosphere and soil, respectively. The results of relationships between microbial community structure and host species identity in the PERMANOVA are given in the higher right of each panel: ∗p < 0.05; ∗∗p < 0.01; ∗∗∗p < 0.001.

