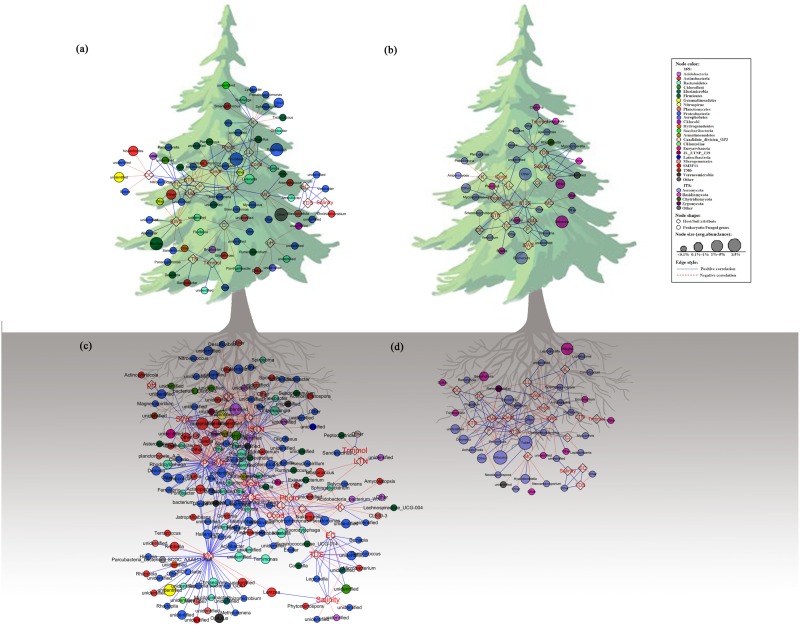
FIGURE 4.
Network analysis showing connectedness between prokaryotic/fungal communities and host/soil factors in the phyllosphere (a,c) and near-root soil (b,d) across the plant holobiont. The blue solid lines represent significantly strong (>0.6) positive linear relationship, red dashed lines represent strong (<–0.6) negative linear relationship. The variables in hexagon boxes show various soil attributes and leaf characters.

