
FIGURE 10.
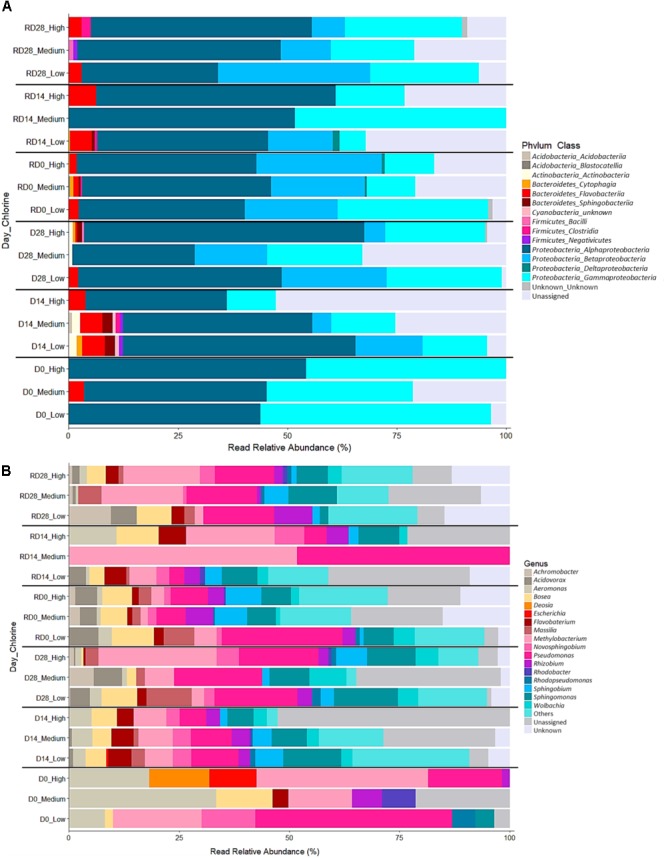
Relative abundance of bacterial classes (A) and genera (B) within biofilms from each chlorine regime, at each sample point. Classes in combination with the phyla they belong to (phylum_class) and genera are shown in the legend for each plot. “Unassigned” refers to sequences for which taxonomic information was unavailable, “Unknown” refers to sequences that were identified at a higher taxonomic level. “Others” in (B) includes 55 genera which were present at <5% relative abundance in any sample.