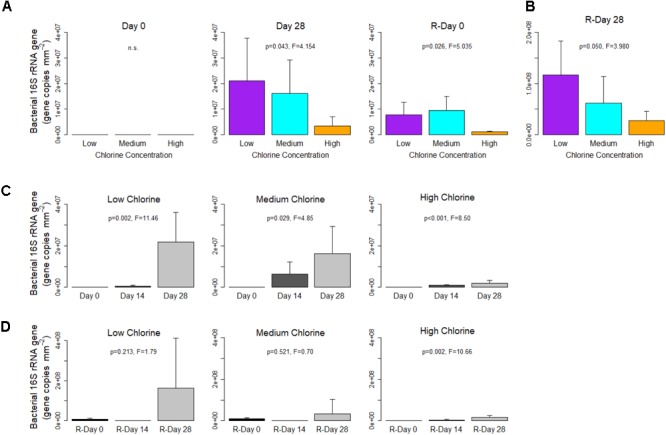
FIGURE 2.

Bacterial gene concentrations within drinking water biofilms developed under different chlorine concentrations. (A,B) show the impact of chlorine concentration, note the different y-axis scale in (B). For each regime, temporal changes are shown with respect to (C) Growth and (D) Re-growth phases. Data presented on a common plot were generated from the same qPCR run, p-values are from ANOVA analysis, n.s = no statistical significant difference, averages (n = 5) and standard deviation are presented.
