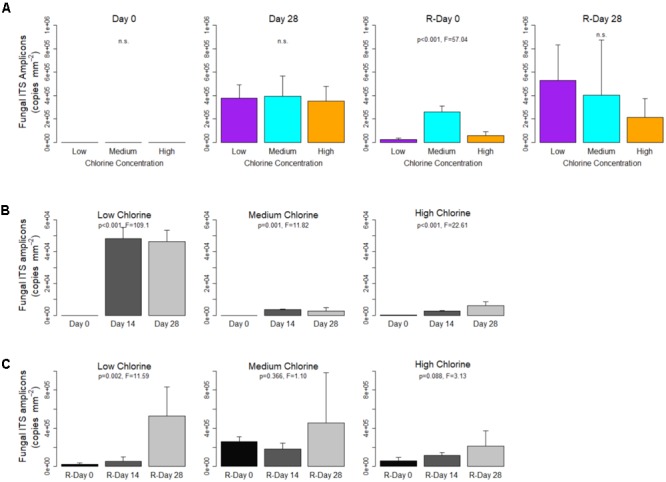
FIGURE 3.

Fungal ITS region concentrations within drinking water biofilms developed under different chlorine concentrations. (A) The impact of chlorine concentration on gene concentration. For each regime, temporal changes are shown with respect to (B) Growth and (C) Re-growth phases. Data presented on a common plot were generated from the same qPCR run, p-values are from ANOVA analysis, n.s = no statistical significant difference, averages (n = 5 or n = 4 see section “Bacterial and Fungal Quantification”) and standard deviation are presented.
