FIGURE 6.

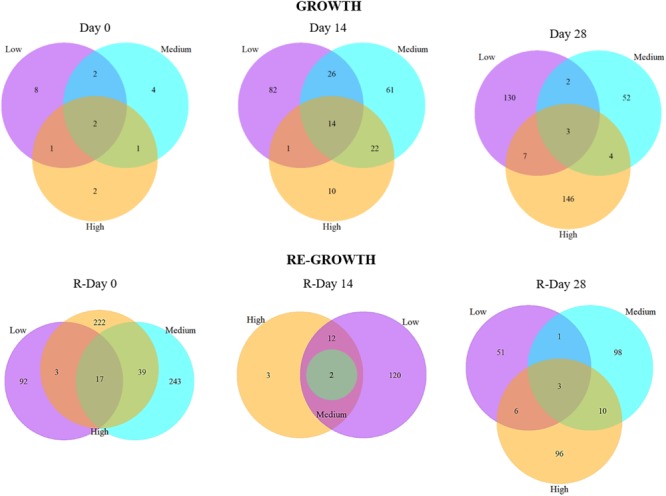
The number of shared and unique bacterial mOTUs within and between biofilms from different chlorine concentrations throughout the Growth and Re-growth phases. Venn diagrams are based on presence/absence mOTU data.

The number of shared and unique bacterial mOTUs within and between biofilms from different chlorine concentrations throughout the Growth and Re-growth phases. Venn diagrams are based on presence/absence mOTU data.