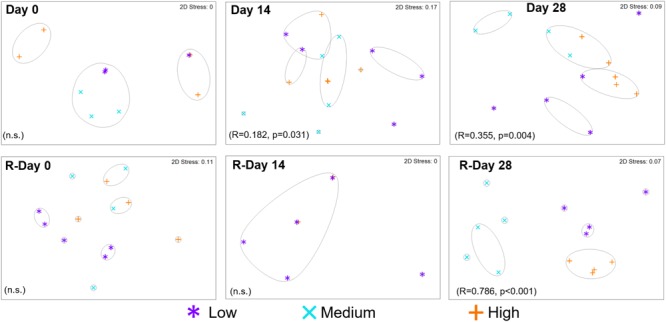
FIGURE 8.

Resemblance between fungal community structures from biofilms developed under three different chlorine conditions and sampled at the time points indicated. Growth and Re-growth data are presented, global-R and p-values are from ANOSIM analysis for chlorine effects, gray lines indicate clusters of at least 30% similarity, based on group averages from hierarchical clustering; n.s. = no statistically significant difference.
