FIGURE 8.
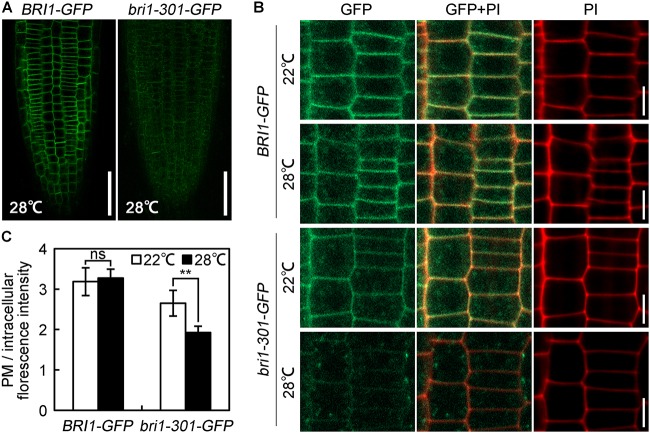
Warm-enhanced endocytosis of bri1-301 protein. (A) Confocal microscopic images of 28°C-grown seedlings. Roots were immediately scanned by confocal microscope after mounting. Scale bars represent 50 μm. (B) The subcellular localization of BRI1 and bri1-301 protein. Roots were stained with PI and then were immediately scanned by confocal microscope. Scale bar represents 10 μm. (C) Quantification of the ratio between the PM and the intracellular BRI1/bri1-301-GFP signal intensities from images shown in (B). The data shown are means and standard deviations. The asterisks indicate statistical significance evaluated by Student’s t-test (∗∗P < 0.01), ns represents not significant. At least 10 roots for each sample were analyzed. Similar results were obtained. One of the representative picture for each treatment is shown.

