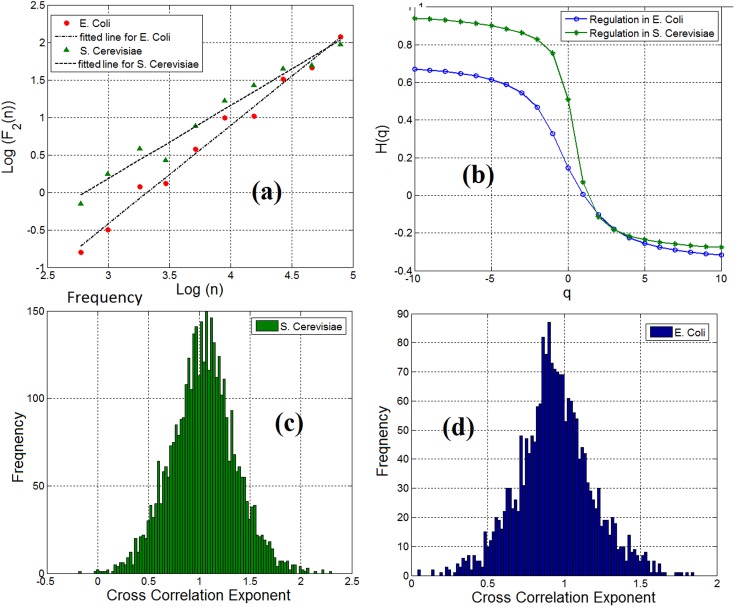
FIGURE 3.
(a) Scaling of detrended covariance function in a gene-TF link in E. coli (ihfB to ompR) and S. cerevisiae (YLR256W to YKL020C) regulatory network. (b) Generalized cross-correlation exponent of a gene-TF link in E. coli and S. cerevisiae. (c) Histogram of cross-correlation exponents of gene regulatory network links in S. cerevisiae and (d) Histogram of cross-correlation exponents of gene regulatory network links.

