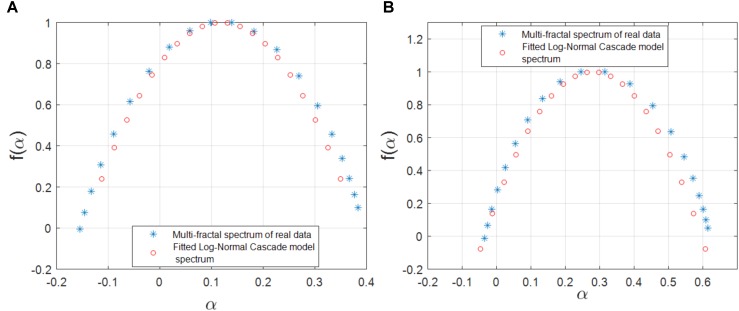
FIGURE 5.
(A) The multifractal spectrum of a cross-dependency (link) between the gene regulatory network of E. coli (soxR and soxS genes) that can best be fitted by the log-normal cascade multifractal model. (B) The multifractal spectrum of a cross-dependency (link) between the gene regulatory network of S. cerevisiae (YKL032C and YKL043W genes) that can best be fitted by the log-normal cascade multifractal model.

