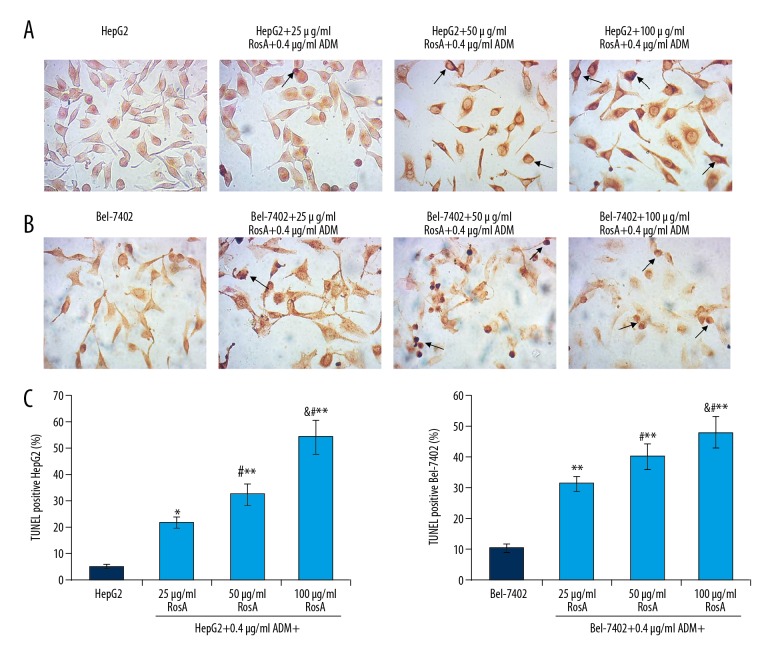
Figure 5.
TUNEL staining of damaged DNA in HepG2 and Bel-7402 cells. (A) TUNEL staining of HepG2 cells. (B) TUNEL staining of Bel-7402 cells. (C) Statistical analysis of TUNEL staining-positive cells. Black arrows represent the TUNEL staining-positive cells. ** p<0.01, * p<0.05 vs. HepG2 or Bel-7402 group, # p<0.01 vs. 25 μg/ml RosA+0.4 μg/ml ADM group, & p<0.01 vs. 50 μg/ml RosA+0.4 μg/ml ADM group.

