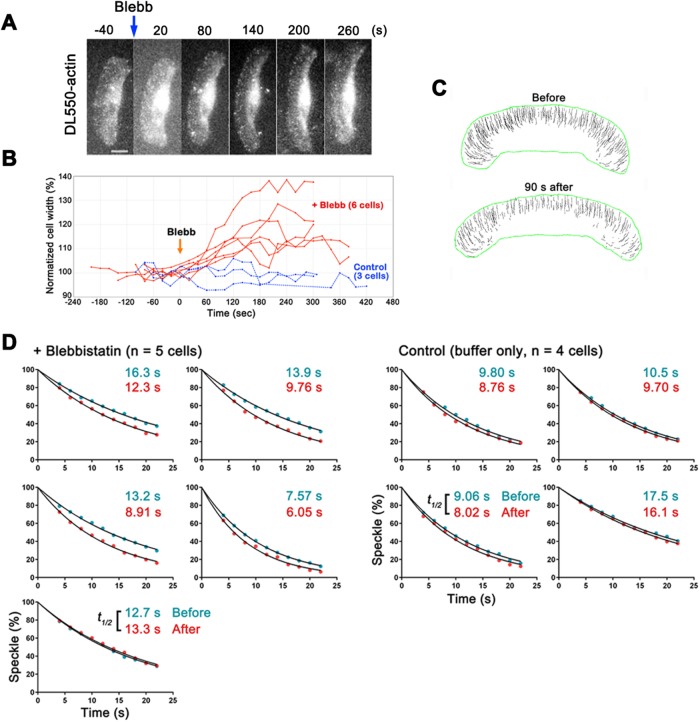
FIGURE 2:
Blebbistatin enhanced actin disassembly in lamellipodia of keratocytes. (A) Time-lapse images of a keratocyte loaded with DL-actin at 60-s intervals. Blebbistatin (50 μM) was added at 0 s. (B) The graph shows variations in the normalized cell width (%) of blebbistatin-treated keratocytes (red lines) and control cells (blue lines). Blebbistatin induced lateral expansion of keratocytes within 2 min. (C) Trajectories of speckles before and 90 s after the blebbistatin treatment. (D) Regression measurements of DL-actin speckles in lamellipodia of keratocytes before (blue dots) and after (red dots) treatment with 50 μM blebbistatin (left). Images were acquired at 2-s intervals. The data were normalized for photobleaching (Watanabe and Mitchison, 2002; Yamashiro et al., 2014). For the regression analysis of DL-actin speckles after the treatment, the first frame of the analysis is within 90–180 s after adding blebbistatin. Right, control cells. The single exponential curve (black lines) fitted to the data gave half-life of speckles (t1/2). The dissociation rate of actin speckles was significantly higher in the cells after the blebbistatin treatment than that in the cells before the treatment (p < 0.05, two-tailed paired t test).

