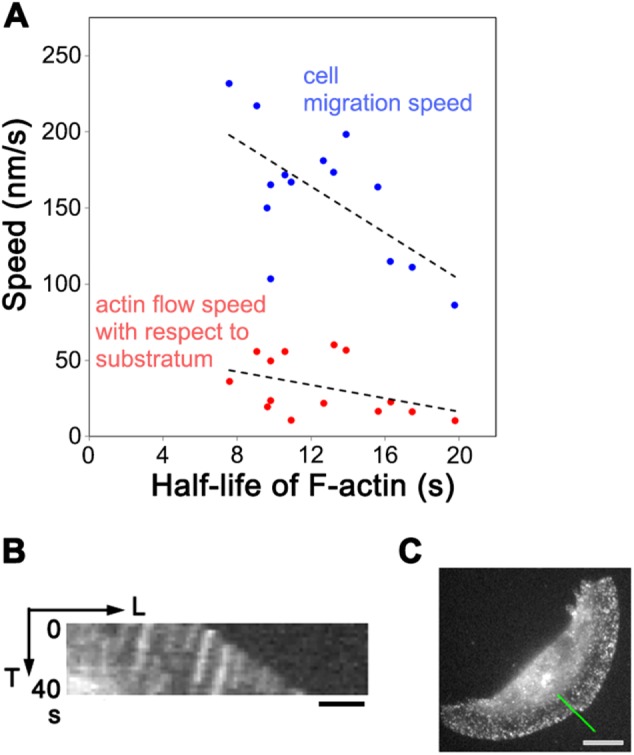
FIGURE 4:

(A) Relationship between the half-life of lamellipodial actin filaments and cell migration speed (blue dots, Pearson correlation coefficient, r = -0.623, p = 0.0172) or actin flow speed with respect to substratum (red dots, r = -0.402, p = 0.154) in individual keratocytes. (B) Kymograph of actin speckles at the cell periphery showing retrograde actin flow toward the cell center with respect to the substratum. Bar, 2 μm. The line in C indicates the region for the kymograph. Bar, 10 μm.
