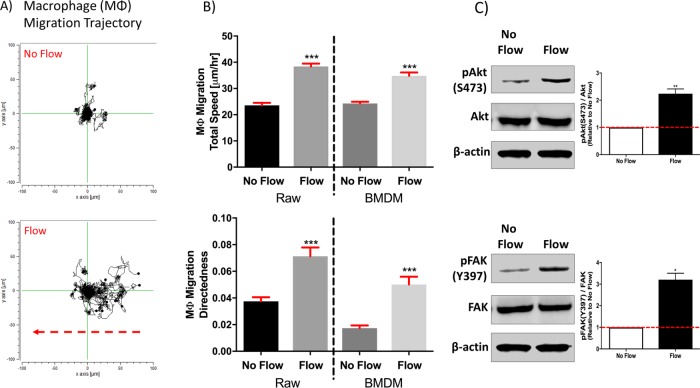
FIGURE 5:
IF promotes macrophage migration in three-dimensional ECM. (A) Representative migration trajectories of Raw macrophages in ECM under no-flow (top) and flow (bottom) conditions. The red arrow indicates flow direction. (B) Interstitial flow (3 μm/s) increased macrophage migration total speed (top) and directedness (bottom) for both Raw macrophages and BMDMs. Bars represent mean ± SEM of data from 50–100 cells (n = 3). (C) Western blot quantification (right) and representative images (left) showing that 1 h of IF (∼3 μm/s) treatment up-regulated the phosphorylation of Akt at Ser473 (top) and FAK at Tyr397 (bottom) in macrophages. Bars represent mean ± SEM of data (fold change relative to no-flow control; n = 3).

