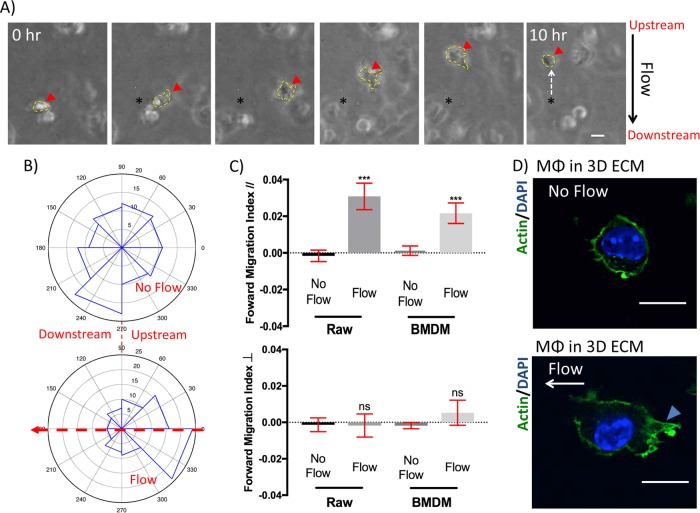
FIGURE 6:
IF directs macrophage migration upstream. (A) Sample time-lapse image sequence showing macrophages migrating against the direction of interstitial flow (upstream) (red arrow, current location of the cell; black asterisk, initial location of the cell; yellow line, outline of the cell; white arrow points to the direction of cell migration, scale bar = 30 μm). (B) Polar histogram showing the distribution of angles of net migration vectors for Raw macrophages in no-flow (top) and IF (bottom) conditions. The red arrow represents the direction of flow. Note that more macrophages migrated upstream (against the direction of the flow). (C) IF (∼3 μm/s) enhanced the forward migration index of Raw macrophages and BMDM in the flow direction (FMI//, defined in Supplemental Figure S11) but not perpendicular to the flow direction (FMI⊥). (D) Representative confocal fluorescence microscopy images (scale bar = 10 μm) showing that actin localized to the periphery of the macrophages when cells were cultured in three-dimensional ECM. IF (∼3 μm/s) treatment led to the accumulation of actin (green) and formation of protrusion (blue arrow) at the upstream (flow-facing) side of the macrophages (bottom). This is in contrast to no-flow control condition (top), in which no spatial preference in protrusion formation or actin accumulation was observed. Quantification is shown in Supplemental Figure S12. Bars represent mean ± SEM of data from 60–100 cells (n = 3).

