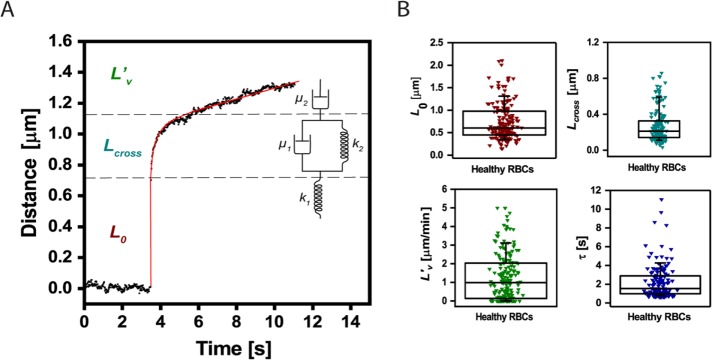
FIGURE 2:
Quantification of RBCs viscoelastic behavior in response to acoustic force pulses. (A) Cellular extension (black dots) can be fitted by means of the Burger’s model (red line). The distance–time curve can then be decomposed using the Burger’s model (see springs and dashpots mechanical analogue), including the instantaneous linear extension L0 (F/k1), a viscous response described by a characteristic time τ (µ1/k2), a viscous elongation Lcross (F/k2), and an extrusion velocity L′v (F/µ2) (see Materials and Methods for detailed description; F is the applied force). (B) Distribution of the parameters L0 (0.6 μm, 90% CI [0.34–1.3]), Lcross (0.21 μm, 90% CI [0.11–0.59]), τ (1.27 s, 90% CI [0.74–4.26]) and L′v (0.99 μm/min, 90% CI [1.35 × 10⁻¹¹–3.12]), as computed from the fitting of AFS data collected for healthy RBCs to Burger’s model. The box plots report median lines and the 10/90% interval.

