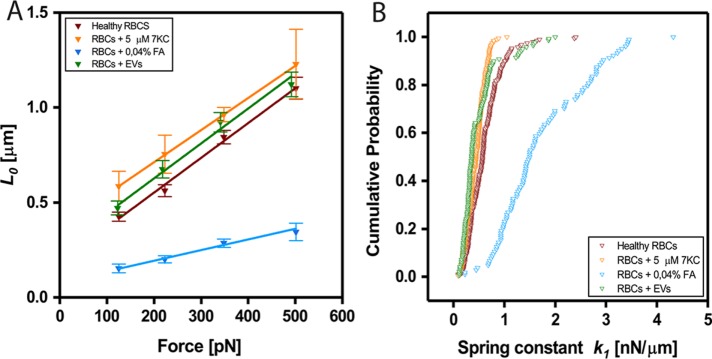
FIGURE 3:
Quantification of mechanical changes on addition of chemicals or EVs. (A) Force dependence of instantaneous elongations L0 for healthy RBCs treated with formaldehyde (0.04%), 7K-C (5 μM), and vesicles. Linear fits yielded values of yhealthy = 0.0018x + 0.19, y7KC = 0.0017x + 0.37, yFA = 0.0006x + 0.08, yEVs = 0.0018x + 0.26. (B) Cumulative probability distributions of measured elastic coefficient k1 per cell (nN/μm) computed for force clamps of ∼350 pN. For healthy RBCs, the median value of k1 was found to be 0.58 nN/μm (90% CI [0.27–1.01 nN/μm]); RBCs treated with 0.04% formaldehyde, 1.50 nN/μm (90% CI [0.81–2.95 nN/μm]); 5 μM 7K-C, 0.45 nN/μm (90% CI [0.21–0.68 nN/μm]); and cells exposed to RBC vesicles; 0.36 nN/μm (90% CI [0.19–0.85 nN/μm]); p < 0.005 (as determined by KS statistical test; see Materials and Methods).

