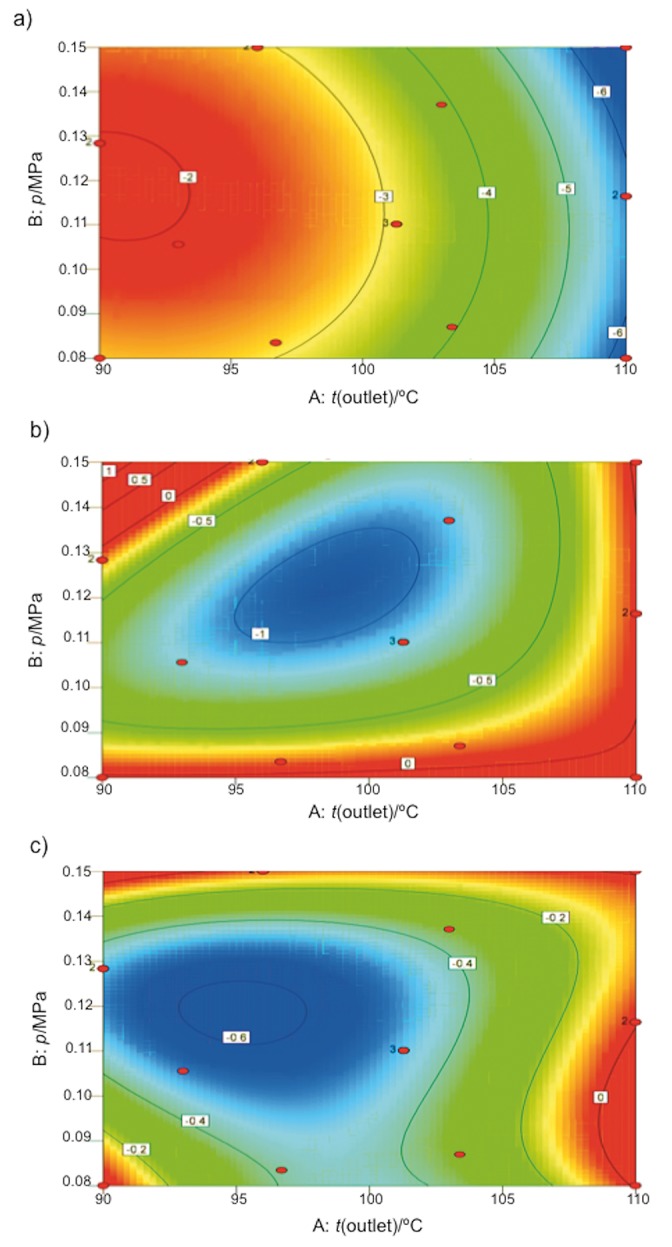
Fig. 2.

Contour plots of bacterial change cycles (N/(log CFU/g)) after: a) spray drying, b) gastric pH conditions after spray drying, and c) bile salt conditions after spray drying

Contour plots of bacterial change cycles (N/(log CFU/g)) after: a) spray drying, b) gastric pH conditions after spray drying, and c) bile salt conditions after spray drying