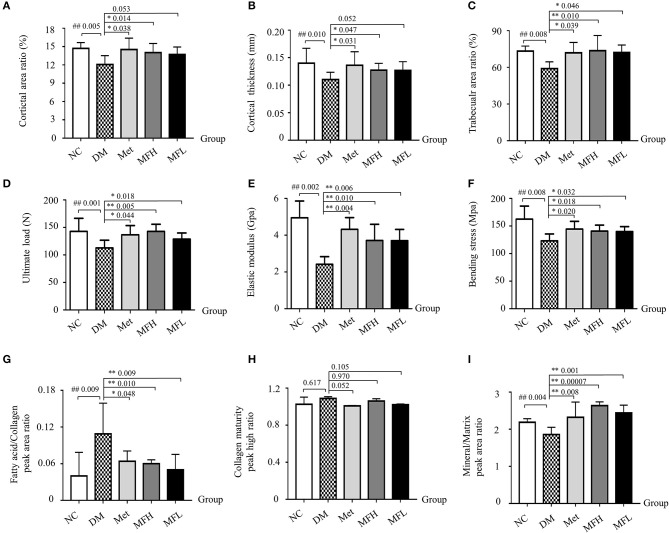
Figure 3.
MF preserved bone strength, biomechanical, and material properties in the femurs of diabetic rats. (A–C) Show cortical area ratio, cortical thickness, and trabecular area ratio in different groups of rats determined by μCT Scanning. (D–F) Show the results of three-point bending examination of ultimate load, elastic modulus, and bending strength in different groups of rats. (G–I) Show the results of fatty acid/collagen, collagen maturity, and mineral/matrix detected by FTIR spectrum. Data are presented as mean ± SD. n = 9. #p < 0.05 or ##p < 0.01 compared with NC group, *p < 0.05 or **p < 0.01 compared with DM group.

