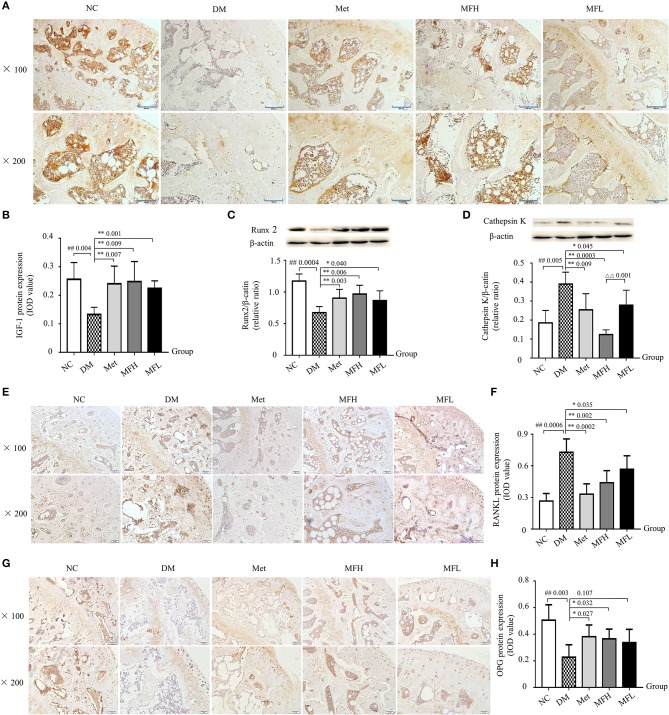
Figure 4.
Treatment of diabetic rats with MF promoted bone formation and inhibited bone resorption in the tibias and femurs. The representative micro-images of IHC staining (sections were counterstained with hematoxylin; original magnification, × 100, Scale bar: 200 μm; × 200, Scale bar: 100 μm) and their analyses show the expressions of IGF-1 (A,B), RANKL (E,F), and OPG (G,H) in the femurs of different groups of rats. (C,D) Show the representative western blot images and their analyses of protein expressions of Runx2 and cathepsin K in the tibias of different groups of rats. Data are presented as mean ± SD. n = 10. The dark brown particles denote positive staining. IOD denotes integrated optical density of interested areas. #p < 0.05 or ##p < 0.01 compared with NC group, *p < 0.05 or **p < 0.01 compared with DM group, ΔΔp < 0.01 compared with MFL group.

