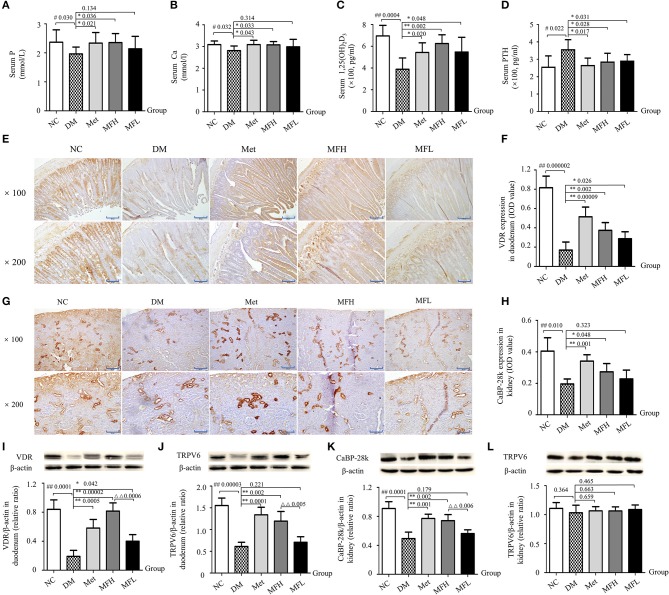
Figure 5.
MF treatment improved calcium homeostasis through regulation of PTH/VDR/CaBP signaling in the duodenums and kidneys of diabetic rats. (A–D) Show serum levels of P, Ca, 1,25(OH)2D3 and PTH in the different groups of rats. (E–H) Show the representative micro-images of IHC staining (sections were counterstained with hematoxylin; original magnification, × 100, Scale bar: 200 μm; × 200, Scale bar: 100 μm) and their analyses of the levels of VDR in the duodenums and CaBP-28k in the kidneys of different groups of rats. (I–L) Show the representative images of western blot and their analyses of protein expressions of VDR and TRPV6 in the duodenums, and CaBP-28k and TRPV6 in the kidneys of different groups of rats. Data are presented as mean ± SD. n = 10. The dark brown particles denote positive staining. IOD denotes integrated optical density of interested areas. #p < 0.05 or ##p < 0.01 compared with NC group, *p < 0.05 or **p < 0.01 compared with DM group, ΔΔp < 0.01 compared with MFL group.

