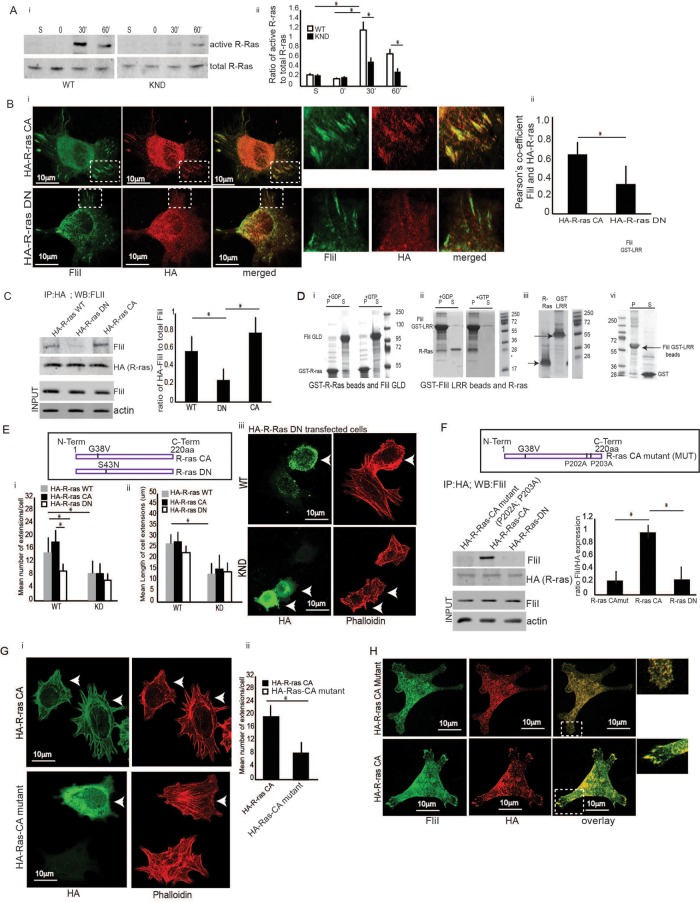
FIGURE 2:
Collagen adhesion promotes R-ras activity. (A, i and ii) FliI WT and KND cells plated on collagen-coated tissue culture plates over 0–60 min. Cell lysates analyzed by immunoblot show maximal R-ras activity at 30 min in FliI WT cells, which was delayed and reduced in KND cells. R-ras activity was specific to collagen substrate adhesion as cells in suspension (S) failed to induce R-ras activity. Blots shown are from three independent experiments. (ii) Data in histogram are reported as mean ± SD and analyzed by ANOVA. (Bi) Representative images of cells transfected with constitutively active (CA) R-ras target to the adhesion sites of the collagen substrates and localize with FliI but not in cells transfected with DN R-ras. Bar, 12 μm. (ii) Histogram showing colocalization data analyzed by ImageJ. Pearson’s correlation was applied to images pairs of FliI and R-ras immunostained cells in. Data in the histogram show 62 and 29% colocalization in HA-R-ras CA and HA-R-ras DN cells, respectively. Data reported as mean ± SD and analyzed by ANOVA from observation made on image pairs of 25 cells. (C) In immunoprecipitation experiments with cells transfected with HA-tagged WT, DN, and CA R-ras, there was 3.5-fold (p < 0.05) and 2.5-fold (p < 0.05) increased association of CA and WT R-ras and FliI compared with DN R-ras-transfected cells. Data in histogram are from three different experiments. Data reported as mean ± SD and analyzed by ANOVA. (D) In vitro experiments showing interaction between R-ras and FliI GLD and FliI LRR domains and requirement of GTP/GDP nucleotides for their interaction. i-GST-R-ras (9 μM) or ii-GST-FliI LRR (8 μM) Sepharose beads incubated with 140 μM GTP γS or GDP in buffer containing 50 mM Tris, pH 7.4, 1 mM EDTA, 20 mM NaCl, and 1% Triton X-100 for 10 min at room temperature followed by GTP γS or GDP. After 30 min, samples precleared with 50 μl glutathione-Sepharose before incubation with purified (i) FliI-GLD (12 μM) or (ii) R-ras (10 μM). These experiments showed (i) no interaction between FliI GLD and R-ras in the absence or presence of GTPγS as the GST R-ras beads and purified FliI GLD protein appear separately in pellet (P) and supernatant (S) fractions. The interaction between (ii) FliI LRR and R-ras required the presence of GTPγS as purified R-ras binds to GST FliI LRR beads and appear in the pellet fraction (P). (iii) GST-LRR and R-ras shown independently before incubation. (iv) In control experiments, GST-FliI LRR beads showed no interaction with purified GST (6 μΜ). (i–iv) S, supernatant, P, pellet. These experiments were repeated three times. One set of representative Coomassie-stained SDS–PAGE gels is shown. (Ei) Data presented in histogram from FliI WT cells and KND cells transfected with HA-tagged WT, CA, and DN R-ras plated on collagen substrate for 60 min show twofold more mean number of extensions/cell in CA R-ras (p < 0.05) and WT R-ras (p < 0.05) transfected cells in FliI WT cells as compared with FliI KND cells. FliI WT cells transfected with HA-WT-R-ras and HA-CA-R-ras show twofold higher number of extensions as compared with cells with HA-DN-R-ras (p < 0.05; p < 0.05). (Eii) FliI WT cells show twofold higher mean length of cell extensions (μm) as compared with FliI KND cells (p < 0.05). (Eiii) Confocal images showing absence of cell extensions in cells transfected with HA-DN R-ras in FliI WT and KND cells. (F) Immunoprecipitations with HA antibody of cells transfected with HA-tagged CA R-ras (P202A; P203A) mutations of the prolines (MUT), HA-CA R-ras, and HA-DN R-ras show absence of interaction between mutated R-ras and DN R-ras with FliI. Data showing fourfold decrease in cells transfected with HA-R-ras mutant (p < 0.05) and HA-DN R-ras (p < 0.05). Data in histogram are from three different experiments. Data reported as mean ± SD were analyzed by ANOVA. (Gi) Representative images of cells transfected with HA-tagged CA R-ras MUT and HA CA R-ras cells and plated on collagen. Transfected cells (arrows) immunostained with HA antibody and phalloidin to localize the nontransfected cells. (Gii) Histogram shows a 2.2-fold reduction in the number of extensions per cell in R-ras mutated cells. p < 0.05. Data reported as mean ± SD, analyzed by ANOVA from three experiments. (H) Confocal images showing localization of FliI and R-ras in cells transfected with HA-CA R-ras mutant and HA-CA R-ras. Transfected cells immunostained with HA and FliI antibody show failed targeting of R-ras to growing extensions and localization with FliI in HA CA R-ras MUT cells (P202A; P203A). Observations were recorded from 20 cells each.

