FIGURE 3:
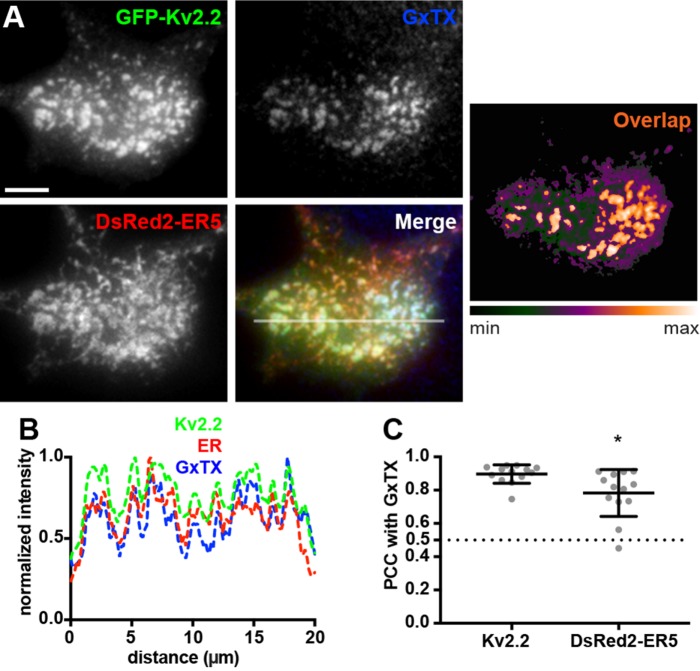
ER–PM junction-localized Kv2.2 channels are expressed on the cell surface. (A) TIRF images of a live HEK293T cell expressing GFP-Kv2.2 (green) and DsRed2-ER5 (red) and surface-labeled for Kv2 channels with GxTX-633 (blue). Heat map shows overlap of GFP-Kv2.2 and GxTX-633 pixels. Scale bar is 5 µm. (B) Fluorescence intensity values across the individual line scan depicted by the white line in the merged image. (C) Graph of PCC between GxTX and Kv2.2 or DsRed2-ER5 measured from live HEK293T cells surface labeled with GxTX-633 and coexpressing GFP-tagged Kv2.2 and DsRed2-ER5. Bars are mean ± SD. See Supplemental Table 5 for values and statistical analyses for C.

