FIGURE 4:
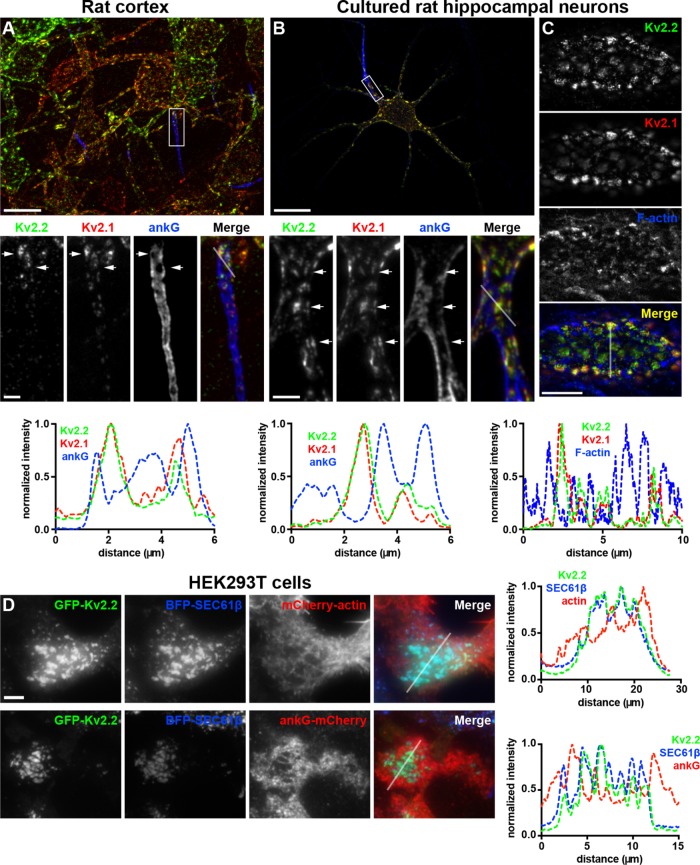
Kv2-mediated ER–PM junctions are located at sites depleted in components of the cortical actin cytoskeleton. (A) Mouse brain section immunolabeled for Kv2.2 (green), Kv2.1 (red), and ankG (blue). Scale bar for large image is 20 µm and for Kv2.2 inset is 3 µm and holds for all inset panels. (B) Projected z-stack of optical sections taken from a CHN immunolabeled for Kv2.2 (green), Kv2.1 (red), and ankG (blue). Scale bar for large image is 20 µm and for Kv2.2 inset is 3 µm and holds for all inset panels. (C) Single optical section taken from the cell body of a CHN immunolabeled for Kv2.2 (green) and Kv2.1 (red) and labeled for F-actin with phalloidin (blue). Scale bar for merged panel is 10 µm and holds for all panels in set. Panels below each set of images show the corresponding normalized fluorescence intensity values across the line scans indicated in the merged images in that column. (D) TIRF images of live HEK293T cells coexpressing GFP-Kv2.2 (green) and BFP-SEC61β (blue) in conjunction with (in red) mCherry-actin (top row) or ankG-mCherry (bottom row). Scale bar for GFP-Kv2.2 panel in top row is 5 µm and holds for all panels in set. Panels to the right of each row show the corresponding normalized fluorescence intensity values across the line scan depicted by the white line in the merged images.

