FIGURE 7:
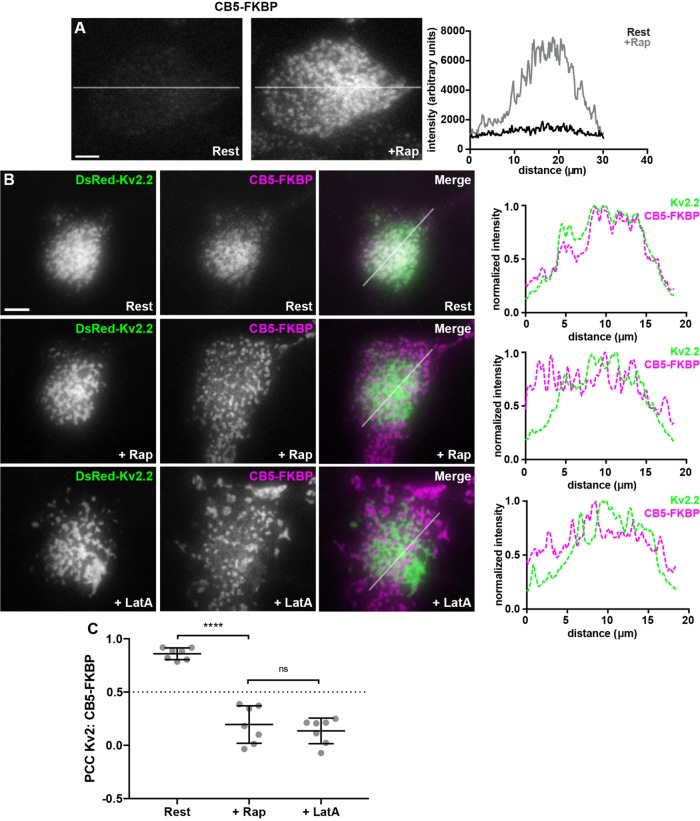
Acutely formed ER–PM junctions are distinct from Kv2.2-containing ER–PM junctions. (A) TIRF images of CFP fluorescence in a live HEK293T cell coexpressing CFP-CB5-FKBP and Lyn11-FRB before (Rest) and immediately after treatment with 5 µM rapamycin (+Rap). Scale bar is 5 µm and holds for both panels. Graph to right of panels shows fluorescence intensity of CFP-CB5-FKBP across the individual line scan depicted by the white lines before (Rest) and immediately following treatment with 5 µM rapamycin (+Rap). (B) TIRF images of a live HEK293T cell coexpressing DsRed-Kv2.2 (green), CFP-CB5-FKBP (magenta), and Lyn11-FRB. Top row: Prior to rapamycin treatment (Rest). Middle row: Same cell immediately following 5 µM rapamycin treatment (+Rap). Bottom row: Same cell after subsequent 15-min treatment with 10 µM LatA (+LatA). Panels to the right of each row are the corresponding normalized fluorescence intensity values across the individual line scans depicted by the white line in the merged images. Scale bar is 10 µm and holds for all panels. (C) Graph of PCC between DsRed-Kv2.2 and CFP-CB5-FKBP. Bars are mean ± SD. See Supplemental Table 12 for values and statistical analysis.

