FIGURE 1:
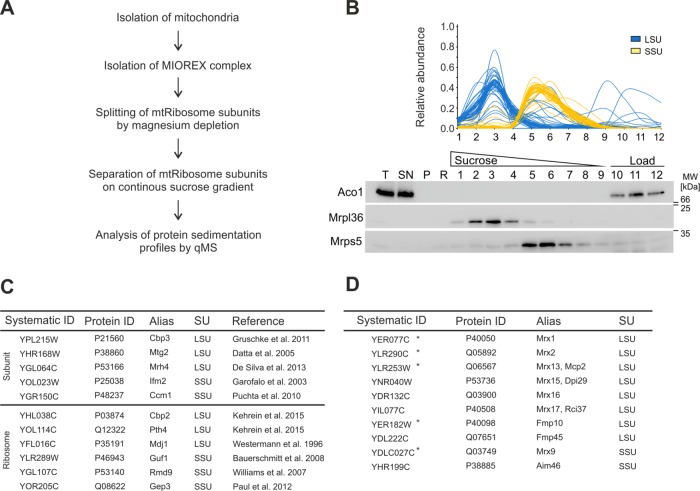
Proteomic profiling of the small and large mitochondrial ribosomal subunits. (A) Strategy to isolate the MIOREX complex with subsequent separation of mitoribosome subunits. (B) After the procedure described in A, the protein abundance of individual fractions from a continuous sucrose gradient was determined by label-free quantitative mass spectrometry. Sedimentation profiles are depicted for the large subunit (blue) and small subunit (yellow). As a control, the experiment was probed for proteins from the large (Mrpl36) and the small (Mrps5) subunit as well as aconitase (Aco1). (C) Top, summary of known interactors of the large and small subunit. These factors showed the same migration behavior as their described ribosomal-interacting subunit. Bottom, summary of known mitoribosome interactors and the interacting subunit found in this study. (D) Summary of known (star) or newly discovered MIOREX components found in this study that comigrated with either the large or the small ribosomal subunit. LSU, large subunit; P, pellet; qMS, quantitative mass spectrometry; R, resuspended; SN, supernatant; SSU, small subunit; T, total.

