FIGURE 1:

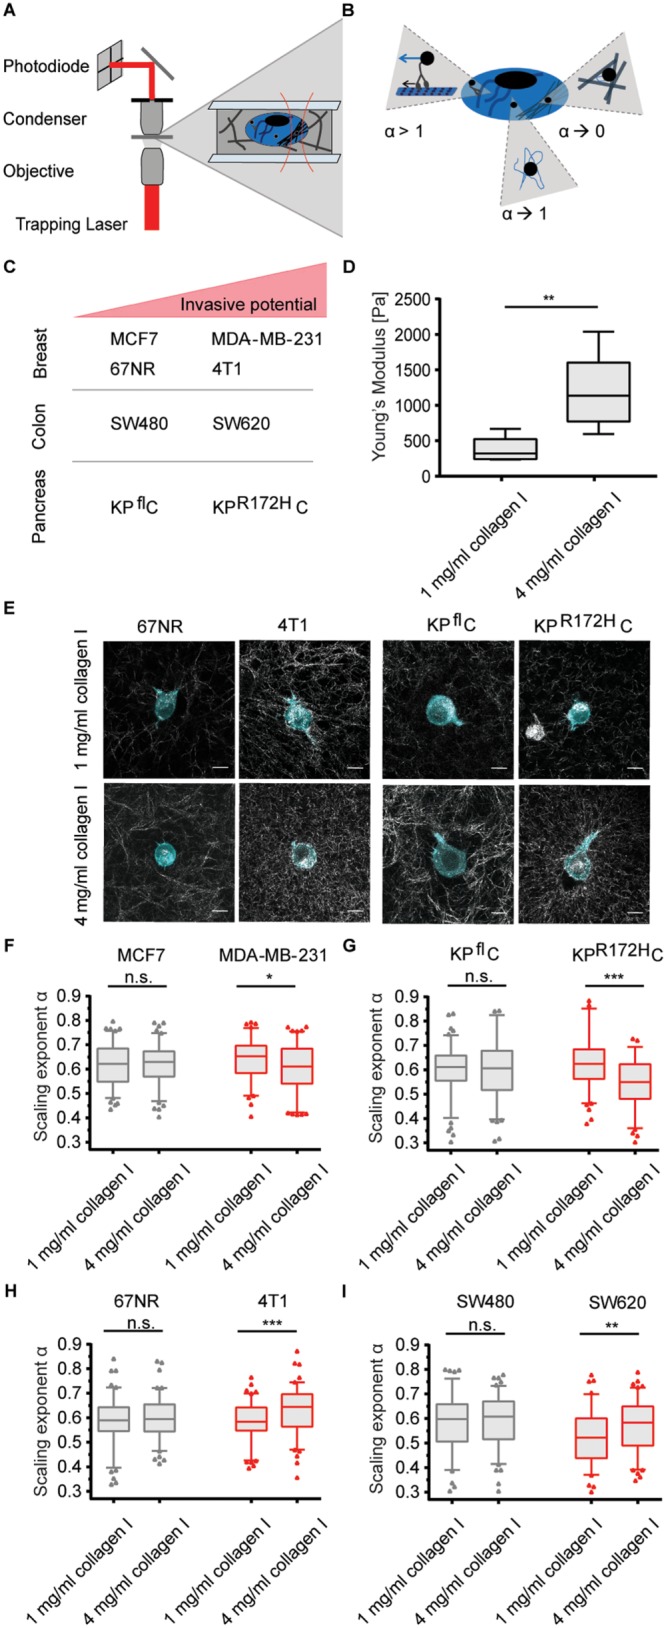
The ability to adjust cytoplasmic viscoelasticity to mechanical properties of the environment correlates with cancer cell invasiveness. (A) Illustration of the optical trapping setup. (B) Schematic illustration of possible origins of different α values: α→1 describes tracer movement in a purely viscous environment; α→0 describes confined tracer motion, e.g., in a densely packed, more elastic cytoplasm; α > 1 indicates superdiffusion, possibly mediated by active motor transportation of a granule along microtubuli. (C) Overview of the cancer cell pairs used in the microrheological measurements. (D) Young’s moduli of 1 and 4 mg/ml collagen I matrices determined by shear rheology. (E) Representative confocal images of mEmerald-lifeAct-7–labeled 4T1 and 67NR breast cancer and KPR172HC and KPflC pancreatic cancer cells cultured in matrices of 1 or 4 mg/ml rat-tail collagen I. Scale bars: 10 µm. (F) Scaling exponents, α, characterizing the intracellular lipid granule diffusion in human breast cancer cell lines MDA-MB-231 and MCF7 at different matrix stiffnesses. The noninvasive cell line (MCF7) is depicted in gray, the highly invasive (MDA-MB-231) in red. (G) Same as F, but for pancreatic cancer cell lines KPR172HC (red, invasive) and KPflC (gray, noninvasive). (H) Same as F, but for mouse breast cancer cell lines 4T1 (red, invasive) and 67NR (gray, noninvasive). (I) Same as F, but for colorectal cancer cell lines SW620 (red, invasive) and SW480 (gray, noninvasive). Box plot of 5th to 95th percentile. ***, p < 0.001; **, p < 0.01; *, p < 0.05; n.s., not significant in a Mann-Whitney test (two-tailed).
