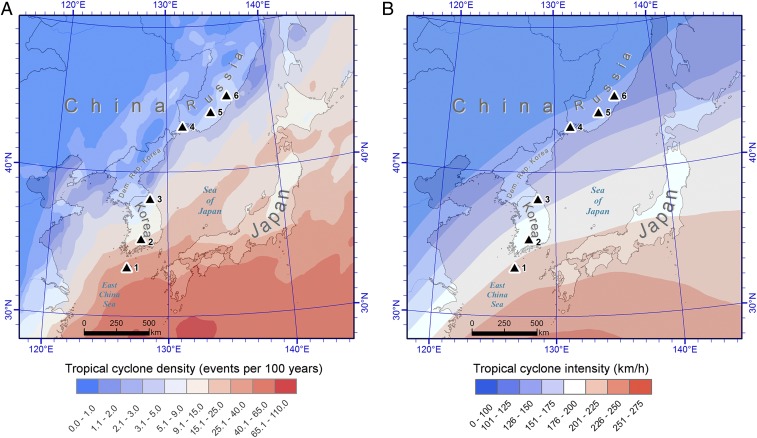
Fig. 1.
Location of our study sites together with mean states of overall TC density and intensity of strong TCs across northeastern Asia. Decreasing gradients of TC frequency (A) and intensity (B) from south to north across our study sites (black triangles). TC frequency was derived from the “Tropical cyclones best tracks 1970-2011” dataset, showing the number of TC events scaled to 100 y. TC intensity shows 50-y return period windspeeds based on “Cyclone wind 50-y return period” dataset. Both datasets were compiled by UNEP/GRID-Geneva based on IBTrACS source data (74). Study site numbering refers to SI Appendix, Table S4.

