Fig. 2.
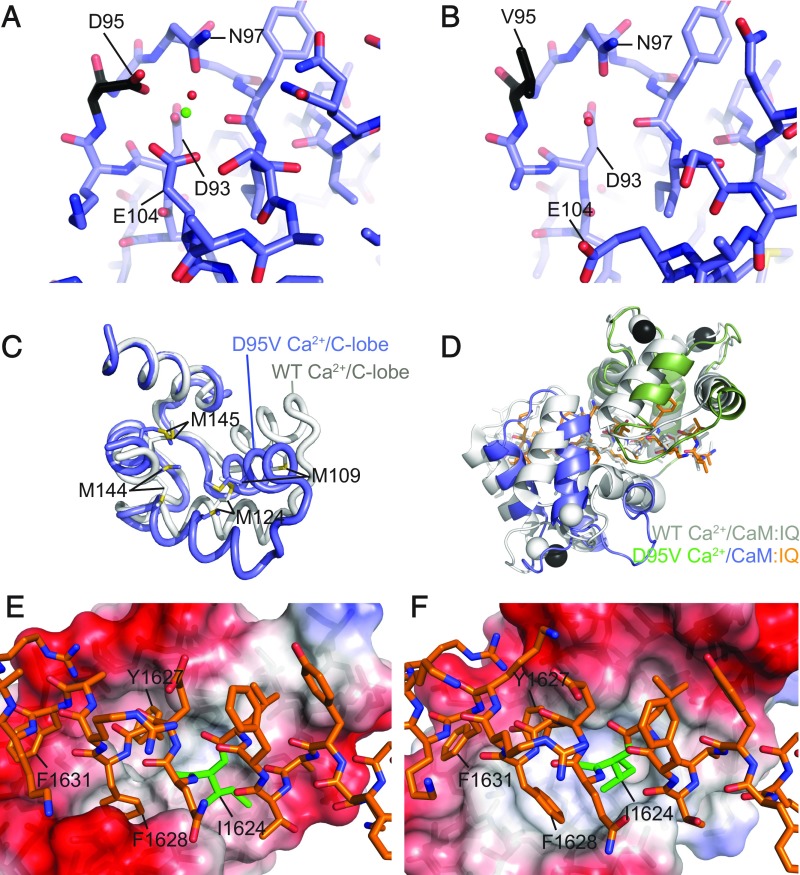
Comparisons of the wild-type Ca2+/CaM- and D95V Ca2+/CaM:CaV1.2 IQ domain structures. Stick representation of EF3 of (A) wild-type Ca2+/CaM (PDB ID code 2BE6) and (B) D95V Ca2+/CaM. Residue 95 is shown in black, calcium ion as a green sphere, and water molecule as a red sphere. (C) Superpositions of C-lobes of wild-type (PDB ID code 2BE6, gray) and D95V Ca2+/CaM (blue). The superposition is based on the first helix of the lobes, highlighting the different conformation. Methionine residues are labeled, showing how M109 and M144, far apart in wild-type, form Van der Waals interactions in the mutant. (D) Superposition of WT Ca2+/CaM (PDB ID code 2BE6, gray) and D95V Ca2+/CaM (N-lobe in green, C-lobe in blue, Ca2+ ions in black) based on the IQ domain. Interactions of the C-lobe of (E) wild-type Ca2+/CaM (PDB ID code 2BE6) or (F) D95V Ca2+/CaM with the CaV1.2 IQ domain. The IQ domain is shown in stick representation with I1624 colored in green; CaM C-lobe is shown in surface representation with the colors indicating the electrostatic potential (red: negative; blue: positive).

